


 |
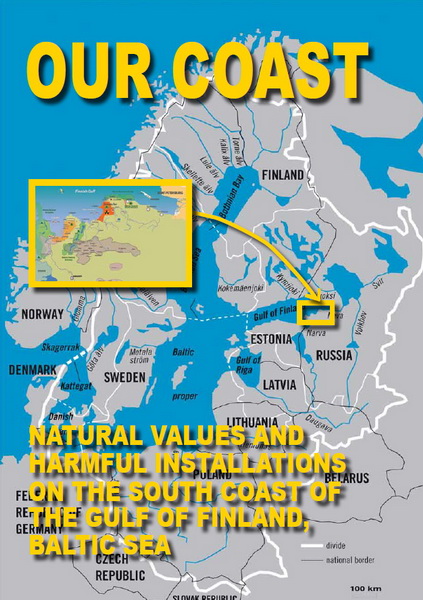
The South Coast of the Gulf of Finland |
|---|---|
| Natural Values and Harmful Installations |
 |
Concept of a decommission plan for old nuclear power reactors |
|---|---|
| Guiding Principles from Environmental NGOs |
1. Structure and Forecast of Energy Consumption in the Republic of Belarus
1.1. Existing Structure and Forecast of Energy Consumption
in Belarus
Following collapse of the USSR, energy balance in Belarus has sharply changed to replacement of coal and fuel oil with natural gas.
 = 10.034 GCal = 1.43 tons of equivalent fuel. Source – I nternational Energy Agency http://www.iea.org/statist/index.ht") Figure 1 - Change in structure of consumption of fuel in the Republic of Belarus during 1990-2006, (here 1 ktoe (ton of oil equivalent) = 10.034 GCal = 1.43 tons of equivalent fuel. Source – I nternational Energy Agency http://www.iea.org/statist/index.ht
Figure 1 - Change in structure of consumption of fuel in the Republic of Belarus during 1990-2006, (here 1 ktoe (ton of oil equivalent) = 10.034 GCal = 1.43 tons of equivalent fuel. Source – I nternational Energy Agency http://www.iea.org/statist/index.ht
 Figure 2 - Change in structure of consumption of fuel for generation of electricity in Belarus in 1990-2006. Source – website of the International Energy Agency http://www.iea.org/statist/index.htm
Table 1 - Balance of natural gas in 2006. Source – International Energy Agency http://www.iea.org/statist/index.htm
| Mln. tons in oil equiva-lent | Mln. tons of equivalent fuel | Bn. м3 | TJoules | % | |
|---|---|---|---|---|---|
|
Own production |
0,20 |
0,27 |
0,23 |
8458 |
1,1% |
|
Import |
19,12 |
25,65 |
22,30 |
802874 |
|
|
Export |
|||||
|
Change in stocks |
-0,21 |
-0,28 |
-0,24 |
-8805 |
|
|
Total consumption |
19,11 |
25,64 |
22,29 |
802527 |
100% |
|
Consumption in energy sector, including |
14,03 |
18,82 |
16,36 |
589063 |
73% |
|
Condensation Power Plants |
3,94 |
5,28 |
4,59 |
165418 |
21% |
|
Cogeneration (CHP) Plants |
6,29 |
8,45 |
7,34 |
264368 |
33% |
|
Boiler Houses |
3,79 |
5,09 |
4,42 |
159277 |
20% |
|
Losses in transportation |
0,20 |
0,26 |
0,23 |
8226 |
1% |
|
Other branches, including |
4,89 |
6,56 |
5,70 |
205238 |
26% |
|
Industry |
1,71 |
2,29 |
2,00 |
71837 |
9% |
|
Transport |
0,40 |
0,53 |
0,46 |
16646 |
2% |
|
Households |
1,32 |
1,77 |
1,54 |
55384 |
7% |
|
Agriculture |
0,03 |
0,04 |
0,04 |
1352 |
0% |
|
Other |
0,04 |
0,06 |
0,05 |
1777 |
0% |
|
Use as raw materials (oil chemistry) |
1,39 |
1,86 |
1,62 |
58242 |
7% |
In the future, until 2020 natural gas would remain main type of fuel for generation of electricity and heat. However, its share in total fuel oil shall be reduced from the pre-sent 80% down to 60% . Natural gas provides for 95-96% of generated electricity.
The “Belenergo” State Concern is the main consumer of natural gas (58%). Indus-try and transport account for 18% of the natural gas, by the way, a couple of oil and chemistry complex enterprises consume more than half of this volume. 90 cities out of 104 and 60 urban settlements out of 110 are heated by burning natural gas.
As of 01 January 2008 installed capacity of all electric power plants of the “Belen-ergo” Concern amounted to 7,882 MW. Heat power plants generate 98% of installed electric capacity in the Republic of Belarus. In addition to heat power plants the energy system has 26 midget hydropower plants with capacity 10.3 MW and isolated generating units of industrial enterprises with installed capacity of 146.8 MW (as of 2005), planned capacity of isolated generating units by late 2008 amounts to 324 MW.
The specific expence of fuel in the energy system, on average in 2006 was 274.6 grams of coal equivalent per Kwh (taking into account heat supply.
Gas-fired energy sector in Belarus is exceptionally inefficient. Performance index in generating electricity by gas-fired thermal power plant is circa 27%, taking into ac-count that modern technologies ensure performance index in generating electricity of 60% (for condensing plants). Event taking into account considerable share of thermal power plants (more than half of installed electric capacity) efficiency of use of natural gas is poor. For “Belenergo” fuel utilization factor, taking into account effective supply of heat and electricity reaches for CHP – only 76%. However, optimal cogeneration may ensure fuel utilization factor reaching 90%.
Equipment is seriously depreciated, thus about 1,000 MW of capacity are perma-nently under repairs. Taking into account winter heat loads, 330 MW of hot and cold re-serves this results in shortage of capacity reserve.
(The hot reserve is rotating reserve (a some amount of fuel is burning) without power delivery to consumer. Power may increase 1-2% (of max power) per minute. The cold reserve is not rotating. Starting time is about 2-6 hours)
Depending on the time of the day, import of capacity in heating season amounts to 500-870 MW.
Repairs and unevenness of consumption lead to low coefficient of use of installed capacity. Average time of operation of energy blocks amounts to circa 3,900 hours per annum (Coefficient of use of installed capacities reached almost 45%).
 Figure 3 - Balance of Electric Power in the Republic of Belarus, source: State Statistics Committee of Belarus
Traditionally the Republic of Belarus fails to provide itself with electric power, covering the shortage through import, mainly from Russia and Lithuania, in parallel ex-porting electric power, mostly to Poland. Growth of production by 12.6% in 2004 re-sulted in increase of export rather than decrease in imports.
Based on the Belarusian State Statistics Committee data, in 2006 total consump-tion of electric power in Belarus amounted to 36.2 bn. kWh, including 31.6 bn. kWh of electric power generated by “Belenergo” Concern power plants, export – 5.8 bn. kWh and import – 10.1 bn. kWh.
 Figure 4 - Structure of Consumption of Electric Power in the Republic of Belarus
The Republic of Belarus is the only FSU state, which has the energy efficiency management system. On annual basis the companies are assigned with plans on energy saving. Reduction of GDP energy intensity amounts to about 6% per annum. During 2000-2005 the Belarusian GDP grew by 42%, whereas consumption of fuel during this period of time increased by 6%. During these years the objective was to reduce GDP total energy intensity by 20-25%.
Actual reduction amounted to 25.3% and plans for 2006-2010 envisage further re-duction of these indicators by 26-30%. Based on preliminary data, the 2007 saw reduc-tion of GDP energy intensity in Belarus by 7.5%, and the 2008 – by 8%. According to the Resolution of the Council of Ministers of the Republic of Belarus №1339, in 2009 it is planned to reduce energy intensity of industrial products by 9%, utility services – by 3%.
 Figure 5 - Forecast of consumption of electric power in 2005
In 2005 it was envisaged to increase the use of local fuels by 340,000 tons. Actual growth amounted to 410,000 tons.
The forecast, made in 2005 [2], has been envisaging that in 2010 consumption of energy would reach 36.9 bn. kWh, in 2020 – 41 bn. kWh. This would require an increase in installed capacity by approximately 650 MW to 8,500 MW.
Table 2 - Structure of consumption of fuel oil in the Republic of Belarus with forecast till 2010. [2]
Types of energy resources 2004 2005 2006 2007 2008 2009 2010
Natural gas 22.8 22.8 22.4 22.51 22.75 22.77 22.7
of which as raw material 1.4 1.46 1.5 1.8 2.2 2.2 2.2
Fuel oil 2.14 1.60 1.7 1.7 1.75 1.73 1.55
of which from own oil (including solid residue of oil processing, starting from 2008) 0.90 0.90 0.90 0.90 0.90 0.90 0.90
Coal, including coke 0.28 0.15 0.16 0.17 0.18 0.19 0.20
Liquefied gas 0.33 0.33 0.32 0.32 0.31 0.31 0.30
Gas, generated by Oil Refineries 0.64 0.45 0.45 0.45 0.45 0.45 0.45
Domestic heating oil 0.11 0.09 0.09 0.09 0.09 0.09 0.09
Other local fuels – total 2.25 2.56 2.80 3.16 3.47 3.80 4.11
Including:
peat and lignin 0.60 0.75 0.94 1.07 1.13 1.15 1.18
Wood fuel 1.07 1.18 1.22 1.44 1.67 1.97 2.24
Continuation table 2
Other types of fuel 0.58 0.60 0.63 0.66 0.67 0.68 0.69
Total boiler house and fuel oil: 28.6 28.0 27.9 28.4 29.0 29.3 29.4
of which without raw materials 27.1 26.4 26.4 26.6 26.8 27.1 27.2
of which own boiler house and fuel oil taking into account gas generated by Oil Refineries, domestic heating oil and other products 3.55 3.86 4.09 4.45 4.75 5.07 5.37
Same, in percentage 13.1 14.6 15.5 16.7 17.7 18.7 19.7
Heat-recovering installations 0.62 0.64 0.69 0.72 0.74 0.76 0.78
Household waste, wind mills 0.01 0.01 0.01 0.02 0.02 0.02
Local resources consumed to generate power – total 4.17 4.50 4.79 5.18 5.51 5.85 6.17
Same, in percentage 15.4 17.0 18.1 19.5 20.5 21.6 22.7
Consumption of electric power, bn. kWh 34.46 34.7 35.0 35.5 36.0 36.5 36.9
Consumption of heat energy, mln. GCal 73.0 73.2 73.9 74.5 75.2 75.9 76.5
In early 2008 the Republican Unitary Enterprise “BelTEI” prepared a forecast of needs of the Republic of Belarus in energy till 2025. [20]. Energy consumption in 2020 was envisaged on the level of 47.1 bn. kWh, which would have required commissioning about 1,000 MW of additional capacities (figures 6 and 7).
 Figure 6 - Forecast of “BelTEI” for consumption of electric power till 2020
The forecast was made, based on assumption that average annual growth of GDP rates for the period from 2005 to 2015 would amount to 7.9%, and 6% during 2015 – 2030. The obtained figure of GDP growth in Belarus corresponds to growth rates in China, which is unlikely to be achieved. As well, the forecast contains a disputed as-sumption that 1% of GDP growth leads to 0.3% growth of energy consumption. Eco-nomic crisis inevitably would introduce corrections into this forecast. During 2009-2010 GDP growth rates shall be expected close to zero, which from the point of view of energy efficiency measures would result in energy consumption decrease by about 6-8% per an-num .
Therefore, for the present note the forecast of energy balance is considered accord-ing to [2].
1.2. Sensitivity of the Belarusian economy to prices for natural gas
First of all, cost of production of electric power is determined by the price for natural gas. Based on data of the Republic of Belarus Ministry of Energy, average cost of production of electric power in the Belarusian energy system in 2007 was US$ 0.064 per kWh.
According to the natural gas supply contract, price for gas is linked to average European price taking into account lowering factor. Starting from Q2 2008 Belarus buys gas at the price of US$ 127.9 per 1,000 m3 [4]. According to the Government of Belarus, in 2009 average entry price for the Russian gas will reach US$ 148 per 1,000 m3. At the same time, in Q1 2009 price for gas will be much higher . By 2011 Belarus should be paying European price for gas.
 Figure 7 - “BelTeI” forecast of consumption of heat energy till 2020
Modeling resulted in conclusion that if measures are not taken, in 5-7 years at the level of energy consumption that has taken shape static losses of well-being with prices for gas increasing up to US$ 230 per 1,000 м3 can make 20% in consumption and de-crease in gross domestic product by 15.7%. In this connection growth of economy ap-pears to be significantly dependent on amount and efficiency of use of natural gas.