Reducing Consumption of Natural Gas in the Republic of Belarus: Nuclear and Innovation Scenarios
Authors:
Vladimir Chuprov, GREENPEACE RUSSIA, head of the energy department, Moscow; Russia
Oleg Bodrov, NGO GREEN WORLD chairperson, Sosnovy Bor – Saint Petersburg, Russia;
Igor Shkradjuk, Ph. D., expert of the International Socio-Ecological Union, Moscow, Russia.
The book edition supported by DECOMATOM International Non-Governmental Organization Network www.decomatom.org.ru
Reducing Consumption of Natural Gas in the Republic of Belarus: Nuclear and Innovation Scenarios: monograph. / DECOMATOM – an International Network of the non-governmental organizations for the investigation international experience for the safety decommission of nuclear power plants; Vladimir A. .Chuprov, Oleg V. Bodrov, Igor’ E. Shkradjuk. - Minsk: Bestprint, 2009. 55 pages.
© Vladimir Chuprov, Oleg Bodrov, Igor’ Shkradjuk, 2009.
© «DECOMATOM» – an International Network of the non-governmental organizations for the investigation international experience for the safety decommission of nuclear power plants, 2009.
Executive Summary
In the nearest future the Republic of Belarus, like many other countries of the world will have to take a decision on how its energy sector is going to look like in the coming decades. Energy security and political status of countries would depend on deci-sions taken in this field.
Critical dependence on import of natural gas, which is becoming more and more expensive on 31 January 2008, pushed the Republic of Belarus National Security Council for taking a political decision to build a nuclear power plant.
A number of factors have not been taken into account in the course of taking this decision, which leads to doubts about correctness of the choice.
- Some input data, used for preparing a feasibility study to build a NPP contained errors:
- NPP capital construction unit costs, used in analysis and modeling – US$ 1,116 per kW – were definitely underestimated. In accordance with the Russian Federation Government figures, the cost of capital construction is almost 2 times higher and amounts to US$ 2,140 per kW (in 2007).
- The NPP feasibility study includes data of the International Nuclear Association, according to which cost of production of electric power, generated by NPP in France amounts to € 0.0254 and € 0.0393 per kWh. Figures of the Republic of Belarus National Academy of Sciences say that commissioning of a NPP into energy system of the repub-lic would provide for stabilizing cost of generation of electric power at the level of US$ 0.13/kWh between 2025 and 2030, whereas “gas-powered” option of development of energy system unit costs would rise to the level of US$ 0.18 per kWh in 2025 and US$ 0.21 per kWh in 2030. However, this is far from being the truth. In 2008 due to increasing costs of construction of the reactor in Flamanville (France) by 20% from € 3.3 to € 4 bn. estimated cost of generation of electric energy grew from € 0.046 to € 0.054 kWh. Evaluation of tenders for construction of NPP in Turkey the stated price of marketed electric power, generated by the Russian-design power generating units amounted to US$ 0.2079 per kWh.
- The decision was taken based on economic calculations, which, however, do not take into account some matters of principle:
- Experience of construction of nuclear power generating units in Russia proves that real costs are much higher than the initial ones. For example, real costs of construction of the third power generating unit of the Kalininskaya NPP (commissioned in 2004) turned to be more than 2 times higher than the envisaged. On top of this, based on calcu-lations of designers of the second stage of the Balakovskaya NPP, a more than 60% in-crease in volume of capital investments into construction makes erection of water-moderated water-cooled power reactors-1000 unprofitable.
- Growth of official costs per capital investments into nuclear generation consid-erably exceeds inflation indicators : within 7 years costs grew almost 3 times – from RUR 20.2 bn per GW in 2000 to RUR 55.7 bn per GW in 2007.
- Construction of NPP would require erection of non-nuclear capacities for additional non-nuclear hot reserve of 550 MW, which costs circa US$ 0.8 bn. and 1 GW pumped-hydrostorage plant to compensate poor flexibility of nuclear energy sector.
- The need to commission an additional hot reserve, based on natural gas, would result in decreasing NPP efficiency, from the point of view of saving gas, by 0.12 bn. m3.
- Since 2005, following the rise and fall in prices for uranium and oil the cost of uranium in relation to oil and gas saw a two-fold increase. Cost of conversion of uranium in the world market from 2004 grew by more than 40%, since 2005 cost of enriching in-creased by approximately 45%. In 2009 the cost of disposal of used nuclear fuel from Ukrainian NPP in Russia increased by circa 17%. All this evidently exceeds the forecast of 0.5% annual growth in cost of nuclear fuel, used in calculations.
- Reduction of energy consumption, which resulted from economic crisis, makes a decision to build an expensive NPP where the construction would take at least eight years, a quite risky one.
- Construction of NPP would lead only to partial solution of the problem of dependency on gas import. Nuclear generation would ensure replacement of approximately 4.35 bn. m3 of natural gas. Taking no account of natural gas, used as raw material (3 bn. m3) means that absolute reduction of the consumed natural gas would reach circa 23% by 2020 – a reduction of import of natural gas for energy sector from 18.5 bn. m3 to 14.1 bn. m3. Other es-timates say that the reduction would reach 3.51 bn. m3 or 20%. Taking into account natural gas, needed for additional hot reserve the reduction effect would be even lower.
- Construction, operation and decommissioning of NPP result in considerable economic and technological risks that should be considered separately.
- Choosing Russian-made water-moderated water-cooled power reactors-1000 as well, means choosing the uranium fuel supplier. None of the countries with NPPs, built by the Soviet Union was able to change nuclear fuel supplier, which is another proof of monopolistic dependency of Belarus from Russia.
Therefore construction of NPP could only partially solve the problem of replacing the imported gas, creating, at the same time, a lot of new problems, including those for the Republic of Belarus budget, because initially unprofitable nuclear fuel cycle would permanently require subsidies during decades. With presence of alternative less expensive and more secure ways of reducing consumption of natural gas, the nuclear scenario is the most expensive and risky.
Considerable reduction of import of natural gas in midterm perspective (20-30 years) would be possible due to modernization of gas energy sector of the Republic of Belarus and use of renewable sources of energy.
An alternative innovation scenario, proposed in the present note, provides for re-ducing consumption of natural gas in the energy sector by almost 50% from 18.5 bn. m3 to 9.3 bn. m3 with costs per unit of the saved natural gas by 20-40% lower than in the nuclear scenario.
Taking into account the above-mentioned it seems expedient, at least, to post-pone construction of NPP. As maximum, it is necessary to take a decision aimed at development in Belarus of energy sector using renewable sources – by 2020 based on biomass and use of wind potential and solar energy in perspective.
Introduction
Karl Georg Høyer, Professor, Research Director
Oslo University College
This very thorough report by the group of experts reminds us that the most critical issues raised by nuclear power use have a global reach and are just as crucial today as they were some thirty years ago. It is worth remembering that in the 70`s and 80`s even Norway was subject to serious nuclear power development planning. According to these plans Norway by now should have had some 12-15 nuclear reactors localized to 4-5 nu-clear power plants. Due to a strong public opposition this was, at least preliminary, re-jected by the Norwegian Parliament already in 1975. Similar plans were also rejected in Denmark, and the two Nordic countries have ever since kept their roles as nuclear power free zones. In Sweden the Parliament decided gradually to dismantle and phase out all their existing nuclear reactors, a decision very much highlighted in the broader interna-tional discussions. However in the later years it has proven difficult for Sweden to keep to the decision.
Two major nuclear reactor accidents should heavily influence both discussions and decisions. The first one in March 1979. A loss-of-coolant accident (LOCA) took place in one of the two reactors at the Three Miles Island nuclear power plant near Harrisburg in Pennsylvania, USA. Before control was regained the reactor was only a few hours from a fuel meltdown accident. 140 000 people had to leave their homes for shorter or longer time. In its effects, uncontrolled emissions of radioactivity to the ambient envi-ronment, it was not a serious accident. But it demonstrated all the potentials of the ut-most severity. And not the least did it demonstrate the necessity to throw all former quantified risk estimates into the garbage can. In USA the accident lead to a moratorium in commissioning new nuclear reactors. It took 6 years before the Three Miles Island re-actor could start up again, a strong proof of the vulnerability of nuclear power as an en-ergy source if larger or minor accidents happen.
Based on the almost unanimous recommendations from a public commission some industrial actors in the mid 1980`s made efforts to restore nuclear power planning in Norway. Their choice of moment was not very lucky, at least for themselves. 26th of April 1986 reactor 4 in the Ukrainian Chernobyl power plant became subject to the most severe nuclear power accident through all history. As widely recognized extensive land areas and populations both in Ukraine, Belarus and Russia were in particular seriously hit by radioactive downfall. But even as far away as the more remote parts of Norway downfalls were large enough to make immediate counter measures necessary in order to protect population from long term health effects. Now more than twenty years later some of these counter measures are still effective, in particular those that were enforced to counteract radioactive Cesium concentration in reindeer and sheep meat generated through mountain grazing. The total downfall of Cesium 137 and 134 over all of Norway was not a large volume in common terms. In theory it could be kept in a tea cup. On the other hand the amount of radioactivity was very large indeed, and at fairly elevated levels is estimated to be present in Norwegian ecosystems through most of this decennium.
Together with other European countries Norway was taken by surprise. In many ways. It was the large geographical outreach of quite heavy downfalls. Almost all Euro-pean countries became victims, many subject to heavily concentrated downfalls at very large distances from the Chernobyl source. These patterns and distances of radionuclide spreading were very different from the existing models used in risk estimation and con-tingency planning. And there were all the biological concentration chains of the radionu-clides, many never envisaged before, at least as regards their proven importance. Former models and estimates of biological halftimes of nuclides were rejected by hard evidence.
Then there was the accident itself. Most European experts – me included – shared the view that the Russian graphite moderated RBMK reactors were inherently less acci-dent prone than the Western light water moderated reactors (LWR), whether of the pres-surized or boiling type. It was generally accepted that the LWR reactors in principle could be subject to a total, uncontrolled meltdown accident, contrary to the RBMK tech-nology. This was the so called “China Syndrome”, hot fuel melting its way down in the ground visually towards China from USA. We were all taken by surprise of the type and extent of the Chernobyl reactor accident. However not by the release of radioactivity when the accident took place after all. Of course, the lack of the external safety barrier in most Russian reactors at that time, so crucial in Western reactors, was heavily criticized.
The report gives a systematic outline of the other major problems usually connected to nuclear power. They are the safety and deeply ethical problems raised by the continuous generation of long life radioactive waste. Similar types of problems caused by long term decommissioning of various types of nuclear fuel cycle plants, reactors, reprocessing and enrichment units. There are the transport safety issues when linking all the fuel cycle plants and activities together. And not the least are there the inherent and potentially seri-ousness in the connections between nuclear power and nuclear bombs, where the very his-tory of nuclear power was founded more than sixty years ago. Nuclear reactors are still continuously generating Plutonium-239, the isotope applied in the Nagasaki nuclear bomb. And enrichment facilities creating opportunities for the generation of sufficiently enriched Uranium-235, the isotope applied in the Hiroshima nuclear bomb.
In Norway as well as in other European countries the strong opposition against nu-clear power caused energy issues to be focused in new ways, also a great asset of this re-port. The large potentials of new forms of energy production from renewable and envi-ronmentally benign sources, sun, wind, biomass and low temperature heat from the ground, have become crucial parts of the new way of thinking on energy, the “soft energy paths”. And in outlining these paths have also extensive energy saving and gains in en-ergy efficiency played important roles. In the aftermaths of the nuclear power opposition and the many no`s to further nuclear power it was mostly a matter of change of focus in discussion. But gradually it has grown to be an integral part of new politics. And as the future is described today, with the overriding response to issues of climate change, the soft energy paths are taken as the very backbone of all-European energy development and policies. Hopefully this report will give its contribution for the similar paths to become a reality also in Belarus.
1. Structure and Forecast of Energy Consumption in the Republic of Belarus
1.1. Existing Structure and Forecast of Energy Consumption
in Belarus
Following collapse of the USSR, energy balance in Belarus has sharply changed to replacement of coal and fuel oil with natural gas.
 = 10.034 GCal = 1.43 tons of equivalent fuel. Source – I nternational Energy Agency http://www.iea.org/statist/index.ht") Figure 1 - Change in structure of consumption of fuel in the Republic of Belarus during 1990-2006, (here 1 ktoe (ton of oil equivalent) = 10.034 GCal = 1.43 tons of equivalent fuel. Source – I nternational Energy Agency http://www.iea.org/statist/index.ht
Figure 1 - Change in structure of consumption of fuel in the Republic of Belarus during 1990-2006, (here 1 ktoe (ton of oil equivalent) = 10.034 GCal = 1.43 tons of equivalent fuel. Source – I nternational Energy Agency http://www.iea.org/statist/index.ht
 Figure 2 - Change in structure of consumption of fuel for generation of electricity in Belarus in 1990-2006. Source – website of the International Energy Agency http://www.iea.org/statist/index.htm
Table 1 - Balance of natural gas in 2006. Source – International Energy Agency http://www.iea.org/statist/index.htm
| Mln. tons in oil equiva-lent | Mln. tons of equivalent fuel | Bn. м3 | TJoules | % | |
|---|---|---|---|---|---|
|
Own production |
0,20 |
0,27 |
0,23 |
8458 |
1,1% |
|
Import |
19,12 |
25,65 |
22,30 |
802874 |
|
|
Export |
|||||
|
Change in stocks |
-0,21 |
-0,28 |
-0,24 |
-8805 |
|
|
Total consumption |
19,11 |
25,64 |
22,29 |
802527 |
100% |
|
Consumption in energy sector, including |
14,03 |
18,82 |
16,36 |
589063 |
73% |
|
Condensation Power Plants |
3,94 |
5,28 |
4,59 |
165418 |
21% |
|
Cogeneration (CHP) Plants |
6,29 |
8,45 |
7,34 |
264368 |
33% |
|
Boiler Houses |
3,79 |
5,09 |
4,42 |
159277 |
20% |
|
Losses in transportation |
0,20 |
0,26 |
0,23 |
8226 |
1% |
|
Other branches, including |
4,89 |
6,56 |
5,70 |
205238 |
26% |
|
Industry |
1,71 |
2,29 |
2,00 |
71837 |
9% |
|
Transport |
0,40 |
0,53 |
0,46 |
16646 |
2% |
|
Households |
1,32 |
1,77 |
1,54 |
55384 |
7% |
|
Agriculture |
0,03 |
0,04 |
0,04 |
1352 |
0% |
|
Other |
0,04 |
0,06 |
0,05 |
1777 |
0% |
|
Use as raw materials (oil chemistry) |
1,39 |
1,86 |
1,62 |
58242 |
7% |
In the future, until 2020 natural gas would remain main type of fuel for generation of electricity and heat. However, its share in total fuel oil shall be reduced from the pre-sent 80% down to 60% . Natural gas provides for 95-96% of generated electricity.
The “Belenergo” State Concern is the main consumer of natural gas (58%). Indus-try and transport account for 18% of the natural gas, by the way, a couple of oil and chemistry complex enterprises consume more than half of this volume. 90 cities out of 104 and 60 urban settlements out of 110 are heated by burning natural gas.
As of 01 January 2008 installed capacity of all electric power plants of the “Belen-ergo” Concern amounted to 7,882 MW. Heat power plants generate 98% of installed electric capacity in the Republic of Belarus. In addition to heat power plants the energy system has 26 midget hydropower plants with capacity 10.3 MW and isolated generating units of industrial enterprises with installed capacity of 146.8 MW (as of 2005), planned capacity of isolated generating units by late 2008 amounts to 324 MW.
The specific expence of fuel in the energy system, on average in 2006 was 274.6 grams of coal equivalent per Kwh (taking into account heat supply.
Gas-fired energy sector in Belarus is exceptionally inefficient. Performance index in generating electricity by gas-fired thermal power plant is circa 27%, taking into ac-count that modern technologies ensure performance index in generating electricity of 60% (for condensing plants). Event taking into account considerable share of thermal power plants (more than half of installed electric capacity) efficiency of use of natural gas is poor. For “Belenergo” fuel utilization factor, taking into account effective supply of heat and electricity reaches for CHP – only 76%. However, optimal cogeneration may ensure fuel utilization factor reaching 90%.
Equipment is seriously depreciated, thus about 1,000 MW of capacity are perma-nently under repairs. Taking into account winter heat loads, 330 MW of hot and cold re-serves this results in shortage of capacity reserve.
(The hot reserve is rotating reserve (a some amount of fuel is burning) without power delivery to consumer. Power may increase 1-2% (of max power) per minute. The cold reserve is not rotating. Starting time is about 2-6 hours)
Depending on the time of the day, import of capacity in heating season amounts to 500-870 MW.
Repairs and unevenness of consumption lead to low coefficient of use of installed capacity. Average time of operation of energy blocks amounts to circa 3,900 hours per annum (Coefficient of use of installed capacities reached almost 45%).
 Figure 3 - Balance of Electric Power in the Republic of Belarus, source: State Statistics Committee of Belarus
Traditionally the Republic of Belarus fails to provide itself with electric power, covering the shortage through import, mainly from Russia and Lithuania, in parallel ex-porting electric power, mostly to Poland. Growth of production by 12.6% in 2004 re-sulted in increase of export rather than decrease in imports.
Based on the Belarusian State Statistics Committee data, in 2006 total consump-tion of electric power in Belarus amounted to 36.2 bn. kWh, including 31.6 bn. kWh of electric power generated by “Belenergo” Concern power plants, export – 5.8 bn. kWh and import – 10.1 bn. kWh.
 Figure 4 - Structure of Consumption of Electric Power in the Republic of Belarus
The Republic of Belarus is the only FSU state, which has the energy efficiency management system. On annual basis the companies are assigned with plans on energy saving. Reduction of GDP energy intensity amounts to about 6% per annum. During 2000-2005 the Belarusian GDP grew by 42%, whereas consumption of fuel during this period of time increased by 6%. During these years the objective was to reduce GDP total energy intensity by 20-25%.
Actual reduction amounted to 25.3% and plans for 2006-2010 envisage further re-duction of these indicators by 26-30%. Based on preliminary data, the 2007 saw reduc-tion of GDP energy intensity in Belarus by 7.5%, and the 2008 – by 8%. According to the Resolution of the Council of Ministers of the Republic of Belarus №1339, in 2009 it is planned to reduce energy intensity of industrial products by 9%, utility services – by 3%.
 Figure 5 - Forecast of consumption of electric power in 2005
In 2005 it was envisaged to increase the use of local fuels by 340,000 tons. Actual growth amounted to 410,000 tons.
The forecast, made in 2005 [2], has been envisaging that in 2010 consumption of energy would reach 36.9 bn. kWh, in 2020 – 41 bn. kWh. This would require an increase in installed capacity by approximately 650 MW to 8,500 MW.
Table 2 - Structure of consumption of fuel oil in the Republic of Belarus with forecast till 2010. [2]
Types of energy resources 2004 2005 2006 2007 2008 2009 2010
Natural gas 22.8 22.8 22.4 22.51 22.75 22.77 22.7
of which as raw material 1.4 1.46 1.5 1.8 2.2 2.2 2.2
Fuel oil 2.14 1.60 1.7 1.7 1.75 1.73 1.55
of which from own oil (including solid residue of oil processing, starting from 2008) 0.90 0.90 0.90 0.90 0.90 0.90 0.90
Coal, including coke 0.28 0.15 0.16 0.17 0.18 0.19 0.20
Liquefied gas 0.33 0.33 0.32 0.32 0.31 0.31 0.30
Gas, generated by Oil Refineries 0.64 0.45 0.45 0.45 0.45 0.45 0.45
Domestic heating oil 0.11 0.09 0.09 0.09 0.09 0.09 0.09
Other local fuels – total 2.25 2.56 2.80 3.16 3.47 3.80 4.11
Including:
peat and lignin 0.60 0.75 0.94 1.07 1.13 1.15 1.18
Wood fuel 1.07 1.18 1.22 1.44 1.67 1.97 2.24
Continuation table 2
Other types of fuel 0.58 0.60 0.63 0.66 0.67 0.68 0.69
Total boiler house and fuel oil: 28.6 28.0 27.9 28.4 29.0 29.3 29.4
of which without raw materials 27.1 26.4 26.4 26.6 26.8 27.1 27.2
of which own boiler house and fuel oil taking into account gas generated by Oil Refineries, domestic heating oil and other products 3.55 3.86 4.09 4.45 4.75 5.07 5.37
Same, in percentage 13.1 14.6 15.5 16.7 17.7 18.7 19.7
Heat-recovering installations 0.62 0.64 0.69 0.72 0.74 0.76 0.78
Household waste, wind mills 0.01 0.01 0.01 0.02 0.02 0.02
Local resources consumed to generate power – total 4.17 4.50 4.79 5.18 5.51 5.85 6.17
Same, in percentage 15.4 17.0 18.1 19.5 20.5 21.6 22.7
Consumption of electric power, bn. kWh 34.46 34.7 35.0 35.5 36.0 36.5 36.9
Consumption of heat energy, mln. GCal 73.0 73.2 73.9 74.5 75.2 75.9 76.5
In early 2008 the Republican Unitary Enterprise “BelTEI” prepared a forecast of needs of the Republic of Belarus in energy till 2025. [20]. Energy consumption in 2020 was envisaged on the level of 47.1 bn. kWh, which would have required commissioning about 1,000 MW of additional capacities (figures 6 and 7).
 Figure 6 - Forecast of “BelTEI” for consumption of electric power till 2020
The forecast was made, based on assumption that average annual growth of GDP rates for the period from 2005 to 2015 would amount to 7.9%, and 6% during 2015 – 2030. The obtained figure of GDP growth in Belarus corresponds to growth rates in China, which is unlikely to be achieved. As well, the forecast contains a disputed as-sumption that 1% of GDP growth leads to 0.3% growth of energy consumption. Eco-nomic crisis inevitably would introduce corrections into this forecast. During 2009-2010 GDP growth rates shall be expected close to zero, which from the point of view of energy efficiency measures would result in energy consumption decrease by about 6-8% per an-num .
Therefore, for the present note the forecast of energy balance is considered accord-ing to [2].
1.2. Sensitivity of the Belarusian economy to prices for natural gas
First of all, cost of production of electric power is determined by the price for natural gas. Based on data of the Republic of Belarus Ministry of Energy, average cost of production of electric power in the Belarusian energy system in 2007 was US$ 0.064 per kWh.
According to the natural gas supply contract, price for gas is linked to average European price taking into account lowering factor. Starting from Q2 2008 Belarus buys gas at the price of US$ 127.9 per 1,000 m3 [4]. According to the Government of Belarus, in 2009 average entry price for the Russian gas will reach US$ 148 per 1,000 m3. At the same time, in Q1 2009 price for gas will be much higher . By 2011 Belarus should be paying European price for gas.
 Figure 7 - “BelTeI” forecast of consumption of heat energy till 2020
Modeling resulted in conclusion that if measures are not taken, in 5-7 years at the level of energy consumption that has taken shape static losses of well-being with prices for gas increasing up to US$ 230 per 1,000 м3 can make 20% in consumption and de-crease in gross domestic product by 15.7%. In this connection growth of economy ap-pears to be significantly dependent on amount and efficiency of use of natural gas.
2. Energy scenarios in the Republic Belarus
2.1. Nuclear Scenario
In Belarus construction of power station using nuclear fuel was started in 1983, when in the vicinity of Minsk erection of the Minsk Nuclear Power Plant began. Its ca-pacity should have reached 2,000 MW. Simultaneously consideration of the issue of con-struction of the second – Belarusian Nuclear Power Plant has started. After 1986 con-struction of Nuclear Power Plant was stopped and Minsk Thermal Power Plant No 5 has been constructed on the basis of Minsk Nuclear Power Plant, 70% of which had been completed by 1986.
In 1992, after USSR collapsed, the Government of Belarus had approved the pro-gram of development of energy sector and power supply till 2010. For the first time after accident at the Chernobyl Nuclear Power Plant in it a separate item had been stipulated an opportunity to build a Nuclear Power Plant in territory of Belarus.
The Resolution of Chairperson of the Republic of Belarus Council of Ministers, adopted on 31 March 1998 has led to creation of the Commission on Evaluation of Expe-diency of Development in Nuclear Engineering in Belarus. The commission consisted of 34 persons, and was headed by the Vice-President of the National Academy of Sciences, Mr. P. A. Vityaz. Having discussed the problem and ways of its solving, the majority of the commission`s members arrived at the following conclusion:
In 2008 leadership of the Republic of Belarus has returned to consideration of an opportunity to build nuclear power plant and on 31 January 2008 the Republic of Belarus Security Council has taken a political decision to build nuclear power plant in Belarus.
State Commission in charge of choosing a place of location of area to build an NPP in Belarus on 20 December 2008 has decided that nuclear power plant will be erected at Ostrovetskaya site in the Grodno Region. Minutes of the meeting of the State Commission and certificate of choosing the place of location of area to build a nuclear power plant were signed. The choice has been based on results of studying three areas: Ostrovetskaya in the Grodno Region, Kranopolyanskaya and Kukshinovskaya sites – in Chaussky and Shklovsky districts of the Mogilyov Region.
2.1.1. Description of Nuclear Scenario
In conformity with the scenario, in 2015 the first unit of the nuclear power plant and by 2020 the second power unit should be commissioned .
Based on calculations, made by the Republic of Belarus National Academy of Sci-ences, commissioning of nuclear power plant with total capacity of 2,000 MW into power supply system of the republic during 2016-2018 will provide for stabilization of cost of production of electric power in Belarus at the level of US$ 0.13 per kWh during 2025-2030, whereas with “gas” option of developing power supply system the costs will rise to the level of US$ 0.18 per kWh in 2025 and US$ 0.21 kWh in 2030.
![Figure 8 - Expected costs for generation of electric power [21]](http://greenworld.org.ru/sites/default/greenfiles/images/fig08.jpg "Figure 8 - Expected costs for generation of electric power [21]") Figure 8 - Expected costs for generation of electric power [21]
Figure 8 - Expected costs for generation of electric power [21]
Authors [21] link reduction of tariffs with commissioning of the NPP first power generation unit.
Nuclear generation shall replace natural gas in the amount of 5 million tons of fuel equivalent. By 2020 the share of nuclear generation in total balance of fuel and heating oil will make 16%, in generation of electric power it would reach approximately 30-32%.
Table 3 - Forecast of structure of consumption of fuel and heating oil by 2020, based on scenarios of development with and without of NPP (in mln. tons of coal equivalent), based on state program of modernization of fixed assets 2005 [2]
| Types of energy resources | Years | |||||
|---|---|---|---|---|---|---|
| 2005 | 2010 | 2015 | 2020 | |||
| With NPP | Without NPP | With NPP | Without NPP | |||
| Natural gas | 22,8 | 22,7 | 23,01 | 20,51 | 24,23 | 19,23 |
| Including as raw materials | 1,46 | 2,2 | 3,0 | 3,0 | 3,0 | 3,0 |
| Fuel oil | 1,6 | 1,55 | 1,6 | 1,6 | 1,4 | 1,4 |
| Coal | 0,15 | 0,2 | 0,2 | 0,2 | 0,2 | 0,2 |
| Liquefied gas | 0,33 | 0,3 | 0,32 | 0,32 | 0,2 | 0,2 |
| Gas generated by Oil refineries | 0,45 | 0,45 | 0,45 | 0,45 | 0,45 | 0,45 |
| Domestic heating oil | 0,11 | 0,09 | 0,12 | 0,12 | 0,1 | 0,1 |
| Local and other | 2,56 | 4,11 | 5,75 | 5,75 | 6,3 | 6,3 |
| Including: | ||||||
| Peat and lignin | 0,75 | 1,18 | 1,3 | 1,3 | 1,4 | 1,4 |
| Wood fuel | 1,18 | 2,24 | 3,2 | 3,2 | 3,5 | 3,5 |
| Other types, including hydropower plants | 0,62 | 0,69 | 1,25 | 1,25 | 1,4 | 1,4 |
| Nuclear fuel | 2,5 | 5 | ||||
| Total | 28,0 | 29,4 | 31,45 | 31,45 | 32,88 | 32,88 |
| Purchased electric power | 1,54 | 1,4 | 1,26 | 1,26 | 1,12 | 1,12 |
| Total: | 29,54 | 30,8 | 32,71 | 32,71 | 34,0 | 34,0 |
Therefore, by 2020 pure growth of consumption of primary fuel and energy re-sources should make about 3.34 mln. tons of coal equivalent fuel (taking no account of natural gas as raw material and import of the electric power). This growth should occur due to local resources, basically peat, hydroelectric power stations and wood fuel. Ac-cording to the State Comprehensive Program of Modernization of Fixed Production As-sets in the Belarusian energy system, energy efficiency and increase in share of own fuel and energy resources used in republic in 2006-2010 (hereinafter the Program), envisages for increase in volume of production and consumption of local fuels and energy resources from circa 4.5 mln. tons of equivalent fuel in 2005 up to 6.17 mln. tons of equivalent fuel by 2010, including (in mln. tons of equivalent fuel):
| Wood fuel and waste of timber cutting | 2,24 |
| Peat and lignin | 1,18 |
| Other types of fuel | 0,69 |
| of which: | |
| Wood processing waste | 0,37 |
| Hydroelectric power station | 0,07 |
| Thermal secondary power resources | 0,78 |
| Household waste and wind turbines | 0,02 |
| Accompanying gas and products of processing of own oil | 1,26 |
According to the Program, it is envisaged to reduce, as well, energy intensity of GDP by 25-30% to the level of 2005.
Proceeding from the suggested scenario, by 2020 electric generation (41 bn. kWh/year) may look approximately as follows:
- NPP – 13.1 bn. kWh (with efficiency of use of installed capacity of 75%);
- Hydroelectric power station – 0.5 bn. kWh;
- Wind – 0.01 bn. kWh;
- Import – 3 bn. kWh;
- Turbine expansion engine installations (60 MW, with efficiency of use of in-stalled capacity of 60%) – 0.3 bn. kWh;
- Thermal power stations, using local fuels (17 MW by 2010, with efficiency of use of installed capacity of 60%) – 0.1 bn. kWh;
- Fuel oil – 1.7 bn. kWh;
- Natural gas (approximately) – 22.3-25.3 bn. kWh (with and without import taken into account).
As it is evident from the referred estimates, the scenario assumes exceptionally low involvement of renewable sources of energy into generation of electric power – 0.9 bn. kWh or 2.1% of total amount of generate electric power by 2020 (taking into account turbine expansion engine installations). The largest part of energy, based on local fuel and energy resources is intended for generation of energy for heating.
Comparison of financial flows for nuclear and traditional gas scenarios, made in 2005 in Sosny Institute, has shown that economic benefit of construction of the nuclear power plant in comparison with construction of new gas-fired capacities is achieved only during 20-th year after commencement of construction [3].
2.1.2. Reduction of Consumption of Gas in the Nuclear Scenario
On the country level, by 2020 absolute reduction of consumption of gas in energy sector will make circa 23% – from 18.5 bn. m3 down to 14.1 bn. m3. Other sources [3] say that reduction will reach 20% – from 18.5 bn. m3 down to 14.9 bn. m3.
Specific (not absolute) reduction of gas consumption also will occur due to modernization of gas-fired capacities (including due to use of combined-cycle plant technologies) and increase of efficiency of electric power generation. According to forecasts about 2,220 – 3000 MW gas-fired capacities should be modernized, therefore burning the same volume of gas would result in increasing generation of electric power.
Based on the fact that the State Production Association “Belenergo” consumes 58% of all volume of gas including raw gas, at present “Belenergo” consumes now about 11.5 bn. m3 per annum of all volume of imported gas (19.8 bn. m3 in 2005). Reduction of gas consumption due to nuclear generation will result in decrease in gas consumption by “Belenergo” accordingly from 11.5 bn. m3 down to 7.2 bn. m3.
Thus, the aggregate heat of combustion of gas burnt by “Belenergo” in the nuclear scenario by 2020 will make 67 bn. kWh. Based on scenario’s 22.3-25.3 bn. kWh, which “Belenergo” will generate it is possible to evaluate approximately the efficiency of burn-ing of the remained volumes of gas: efficiency of electric power generation by burning gas will amount to circa 33.3-37.8%. This provides for potential of further decrease in consumption of gas, taking into account the best global practice .
Irrespective of the decision to build nuclear power plant the use of local fuel and energy resources would provide for a significant contribution to saving of natural gas – by replacing potential import of gas in the amount of 6.3 mln. tons of equivalent fuel by 2020.
2.1.3. Cost of Capital Construction in the Nuclear Scenario
According to the Russian government, the cost of nuclear generation in 2007 was RUR 55.7 bn. per 1,000 MW [5], which at the rate of US$ 1 (in 2007) equals RUR 26 making about US$ 2.14 bn. per 1000 МВт. Cost of construction of 2,000 MW capacity nuclear power plants (without an additional infrastructure) theoretically will result in US$ 4.28 bn. in 2007 prices.
Taking into account construction of infrastructure, additional expenses will amount up to US$ 1.5 bn. [7]. Total capital expenditures in this case will reach US$ 5.78 bn.
These costs do not include creation of additional hot reserve of capacities of 550 MW (US$ 0.8 bn.) and construction of hydro-accumulation (pumped storage hydro) power plant with 1 GW capacity. Cost of hydro-accumulation power plant depends on concrete site, but its construction can cost US$ 2 bn.
In the course of construction, undoubtedly, there will be a rise in price of construc-tion of nuclear power plant. The Russian experience shows that cost increase considera-bly exceeds inflation: more than two times in excess of the declared cost for 4 years of construction (as well, see section 4).
In order to evaluate the cost of capital in the construction of the nuclear power plant, it is possible to compare it with costs of activities in the field of energy efficiency and use of local fuels and energy resources. With aggregate consumption of fuel oil (28 mln. tons of coal equivalent in 2005, taking no account of gas used as raw material) total saving of power resources, resulting from energy saving activities at the end user stage by 2010 will amount to 4.6 mln. tons of coal equivalent 16% to the 2005 level).
Due to local fuel and energy resources it is envisaged to receive an additional 3.74 mln. tons of equivalent fuel of primary energy (6.3 in 2020 – 2.56 in 2005) that actually allows covering growing energy consumption without increasing consumption of natural gas. During 2006 – 2010 local fuel and energy resources are to provide an additional 1.67 mln. Tons of equivalent fuel (Table. 1) Cost of activities aimed at using local fuel and energy resources to 2010 amounts to US$ 0.75 bn. Economic benefit of replacement of imported gas of local fuel and energy resources (mainly, wood fuel) and activities in the field of energy efficiency is much higher compared with costs of construction of nuclear power plant .
Table 4 - Comparison of economic benefit in energy efficiency, based on use of own fuel and energy resources in 2006-2010 and construction of nuclear power plant
| Capital in-vestments, US$ mln. | Expected economic ef-fect, thousand tons of coal equivalent per an-num | Unit capital costs, US$/ton of fuel equiva-lent | |
|---|---|---|---|
|
Energy efficiency |
1852,2* |
4600,0* |
402,6 |
|
Local fuel and energy resources |
747,8* |
1380,0** |
542 |
|
NPP/ |
4280,0/ |
5000,0 |
856/ |
*Taking no account of “Belenergo” Concern facilities.
**Additional volume of replacement of imported fuel, obtained during 2006 – 2010.
Specific costs of energy efficiency activities are more than 2.2-3.3 times lower than construction of nuclear power plant, if recalculate cost of saving of 1 ton of equiva-lent fuel. Accordingly, introduction of local fuels and energy is 1.6-2.4 times cheaper than NPP construction.
To evaluate the cost of modernization and commissioning of new capacities in gas generation it is possible to use following data. Estimated cost of modernization of the Minsk thermal power station-3 with 230 MW capacities on the basis of combined cycle plants is US$ 160 mln. or US$ 700 per kW . On the other hand, according to practice of construction of combined cycle plants in Russia, now approximate cost of construction of combined cycle plants is RUR 37,000-38,000 per KW of installed capacity or about US$ 1,450/kW (with US$ 1 equal to RUR 26).
Thus, taking into account that till 2020 it is envisaged to modernize and commis-sion 2,220-3,000 MW of gas generation, the cost of modernization and commissioning of new capacities will be circa US$ 3.2-4.4 bn. in 2007 prices.
2.2. Innovation Scenario Based on Renewable Energy Sources
There is no officially recognized or seriously discussed non-nuclear scenario, based on significant share of renewable sources of energy . However, such scenario can be evaluated based on available data about renewable sources of energy potential, secon-dary resources and energy efficiency in gas generation.
2.2.1. Potential of renewable energy sources
Below there are various evaluations of potential of renewable sources of energy.
Table 5 - Evaluations of renewable sources of energy and secondary resources potential
| Type of resource | Technical potential [2] | Economic potential [2] | Technical potential (other sources, except [2]) | Economic poten-tial (other sources, except [2]) |
|---|---|---|---|---|
|
Wood fuel and wood processing waste, mln. tons of equivalent fuel |
6,6 |
3,06 |
4.45 [13] taking into account energy planta-tions (lower estimate) |
|
|
Hydrological resources |
2,27 bn. kWh |
0,39 bn. kWh |
0.11-0.15 mln. tons of equivalent fuel |
|
|
Wind energy potential, bn. kWh |
2,4 |
6,62 |
224 [9] |
2.24-15.65 [9] |
|
Biogas, obtained from processing of cattle breeding, mln. tons of equivalent fuel |
0,162 |
0,026 |
1,25-1,75 [13] |
|
|
Solar energy, mln. tons of equivalent fuel |
71 |
0,003 |
0,25-0,5 |
0.25-0.5 heat [13] 0.25 electric power [13] |
|
Household waste, mln. tons of equivalent fuel |
0,47 |
0,02 |
0.5 [13] (taking account of lignin and crop sector) |
|
|
Phytomass, mln. tons of equivalent fuel |
0,64 |
0,05 |
0,3 |
|
|
Lignin, mln. tons of equivalent fuel |
0,983/p> |
0,05 |
||
|
Crop sector waste, mln. tons of equivalent fuel |
1,46 |
0,02-0,03 |
||
|
Low potential heat of Earth of technological discharges, mln. tons of equivalent fuel |
1.4 (heat secondary resources) |
1,5-2 [13] |
||
|
Combustible secondary resources, mln. tons of equivalent fuel |
0,58 |
|||
|
Turbine expansion en-gines |
60 МВт |
0.25 mln. tons of equivalent fuel [13] |
||
|
Boiler house steam en-ergy |
0.32 mln. tons of equivalent fuel [13] |
In the nearest decades the most perspective directions of development of renew-able sources of energy are the wind energy and generation of energy, based on biomass.
2.2.2. Wind Energy
Prior to 1960-ies in territory of modern Belarus circa 20 thousand various wind energy generating units were in operation. The situation has sharply changed in 1960-ies when centralization of electric power supply has been carried out in all territory of the USSR, including Byelorussian Soviet Socialist Republic.
Opportunities of developing wind power engineering in the Republic of Belarus have been already examined. “Wind power generation in Belarus should develop more intensively and on the basis of experience already accumulated in the country”, – said Sergey Sidorsky, the Prime Minister of Belarus, taking the floor at session of Presidium of the Council of Ministers, considering the draft program of development wind power engineering branch in Belarus for 2008-2014 [22].
Annual wind power engineering potential, technologically accessible for use by existing wind energy generating units with nominal wind speed of 14 m/sec is evaluated circa 224 bn. kWh [9]. Regions with optimum wind conditions, with average annual speed of wind exceeding 5 m/s at height of 10 m above surface of the ground are Minsk, Vitebsk and Grodno [10]. Average speed of winds in Belarus in the winter is higher than in the summer and in the afternoon is higher than at night. Global climate change leads to increase in strong winds. Therefore in due course of time the potential wind power engi-neering will increase.
To specify places of location of existing wind energy generating units in other dis-tricts and regions there exists wind power engineering atlas developed by “Belenergoset-project” and wind power engineering databank developed by Scientific and Production Enterprise “Vetromash” [11]. In territory of Belarus there are 1,840 sites suitable for con-struction wind energy generating installations where 5 to 20 of such units can be placed at each site.
 Figure 9 - Map of division into districts, based on wind speed in Belarus
From technical point of view, it is believed that the share of unstable wind energy generating installations in the network should not exceed 30-40%. Assuming as basis the growth of power consumption in the Republic of Belarus up to 41 bn. kWh by 2020 and share of wind power in electric balance as 30% the volume of electric power that can be put into the network by wind energy generating installations in Belarus will make 12.3 bn. kWh. The volume of a wind resource offered for use is within economically accessible po-tential of wind power engineering in the Republic of Belarus – 15.65 bn. kWh [12].
Using wind energy generating installations with individual capacity of 2 MW, generating 3.5 mln. kWh per annum at average annual wind speed of 5.7 m/sec at height of 30 m above the surface to achieve the objective (12.3 bn. kWh) it is necessary to commission 3,514 wind energy generating installations with aggregate installed capacity of 7,028 MW.
Results of calculation of financial flows are provided below to evaluate costs of wind generation for 7,028 MW wind energy generating units with the following assump-tions:
- Manufacturing and erecting of installations – 10 years,
- Initial cost of wind energy generating unit – US$ 1,000/ kW (the price achieved in Western Europe in 1998);
- Annual reduction of costs for manufacturing – 5% ;
- Wind energy generating unit service life of 20 years and then dismantling. Cost of dismantling is 6% of wind energy generating unit cost, proceeds from recycling scrap metal – 8%.
 for wind energy generating unit with 7,000 MW capacity") Figure 10 - Proceeds (financial flow) for wind energy generating unit with 7,000 MW capacity
Figure 10 - Proceeds (financial flow) for wind energy generating unit with 7,000 MW capacity
Calculations show that payback of the project will happen 10 years after com-mencement of construction, which is comparable with time of payback of nuclear genera-tion. The cost of generation of electric power without cost of financial services would be US$ 0.0301 /kWh.
Use of wind potential in the proposed volume allows excluding construction of nuclear power plant and reducing consumption of imported natural gas by approximately 4.1 bn. m3 .
As the cycle of construction wind energy generating unit takes less than a year it is possible to adjust promptly commissioning of wind energy generating capacities depend-ing on dynamics of energy consumption. Experience of Germany shows that if generation of electric energy by wind power stations does not exceed 14% of the total generation in the system, then to compensate for dip in generation in windless weather no reserve ca-pacities are required. For the wind-generated energy exceeding 14% in the energy sys-tem, the volume of reserve capacities ranges between 8 and 15.3% from the wind power stations, i.e. 300-570 MW.
As well, it is expedient to manufacture wind energy generating units for small wind speeds (with vertical axis). In this case Belarus receives both: an independent en-ergy source, reduction in import of fuel and energy resource and an opportunity to export wind energy generating units, first of all, to Russia. Horizontal axis wind energy generat-ing units prevailing in the world are designed for higher wind speeds and are almost not appropriate for Central Russia conditions.
2.2.3. Use of Biomass in Generation of Energy
Use of waste, generated by wood processing and agriculture as fuel can provide at least 3 mln. tons of equivalent fuel. According to [13], this amount can grow to 4.45-8.9 mln. tons of equivalent fuel solely in forestry (basically due to energy plantations). Birch, willow, poplar, spruce and pine are considered plantation cultures.
According to [2], it is envisaged to use, as well, biomass of fast-growing plants at depleted peatlands of 180,000 hectares. Here it is planned to receive up to 0.3 mln. tons of equivalent fuel of biomass or 1.7 tons of equivalent fuel per hectare per annum. For-eign experience of cultivation of energy cultures shows that it is possible to get 5-6 tons of equivalent fuel per hectare. Thus, using the best practice of cultivation of energy cul-tures it is probable to get from the depleted peatlands up to 1 mln. tons of equivalent fuel of biomass. In case 1 mln. hectares is used to cultivate energy cultures (about 5% of the Republic of Belarus territory) it is likely to receive additionally circa 5 mln. tons of equivalent fuel.
The Republic of Belarus has a significant potential of animal breeding waste. Cal-culation of technical potential of biogas generation based on animal breeding waste is presented in the table.
Table 6 - Calculation of technical potential of biogas generation,
based on animal breeding waste [13]
| Store-cattle | Milk cows | Pigs | Poultry | Total | |
|---|---|---|---|---|---|
| Manure output, kg/capita per day | 50 | 45 | 3,5 | 0,3 | |
|
Biogas output, m3/capita per day |
2,43 | 1,62 | 0,2 | 0,02 | |
|
Head of livestock, mln. heads (in 2007) |
2,5 | 1,45 | 3,5 | 29,4 | |
|
Manure output, mln. tons per annum |
45,6 | 23,8 | 4,5 | 3,2 | 77,1 |
|
Biogas output, bn. m3 per annum |
2,2 | 0,9 | 0,26 | 0,2 | 3,5 |
|
Biogas output, mln. tons of equivalent fuel |
1,3 | 0,5 | 0,15 | 0,1 | 2,1 |
According to [13], economically accessible potential of biogas is 1.25-1.75 mln. tons of equivalent fuel.
In addition to biogas, manure processing results in production of fertilizers. Com-pared with fertilizers received from manure in usual way, productivity increases by 10-15%. Production of fuel, decrease in environmental pollution and production of fertilizers make generation of biogas from manure and vegetative waste economic already today. Experts of the republic should take a closer look at experience of Republic of Tatarstan, where majority of farms are equipped with biogas installations.
2.2.4. Potential of Energy Efficiency in Gas Generation
Efficiency of modern use of natural gas in the Republic of Belarus can be evalu-ated on example of State Production Association “Belenergo”, which is the major con-sumer of natural gas in the Republic of Belarus, consuming about 11.5 bn m3 per annum.
Total heat of combustion of gas, used by the State Production Association “Belen-ergo”, with heat of combustion 1 m3- 9.4 kWh is 108.1 bn. kWh. The State Production Association “Belenergo”, generating practically all electric and almost half of thermal energy, per annum supplies about 30.37 bn. kWh of electric energy). The share of gas in fuel balance of the State Production Association “Belenergo” amounts to 95.7% [2]. Based on this, it is possible to evaluate that combustion of gas results in generation of 29 bn. KWh of power. Average efficiency of electric energy in gas generation is 26.9% that is a low parameter, as efficiency of electric energy in gas generation can reach 60% in condensation mode and 40% in cogeneration mode.
The State Research and Development Enterprise “Zorya – Mashproject” already accumulated successful experience of modernization of steam-power units of Bere-zovskaya State District Power Plant (Beloozersk, Brest region). From July 2003 till December 2004 the power plant underwent installation and commissioning as gas-turbine superstructure to existing boilers PK-38R – 4 gas-turbine units GTE-25 25 MW each. The State District Power Plant capacity went up from 330 to 420 MW and the total con-sumption of fuel gas grew only by 5%. Specific consumption of equivalent fuel de-creased from 370 grams of equivalent fuel per kWh down to 307 grams of equivalent fuel per kWh.
Based on example of modernization of the Minsk thermal power station-3 it is possible to show that decrease in specific consumption can make from 320 grams/kWh at efficiency of 36% down to 179.2 grams/kWh with efficiency of 52-54%.
The installed capacity of gas generation (which will be presented mainly by ther-mal power plants) to generate 14.1 bn. kWh in the innovative scenario will require circa 3,500 MW with coefficient of use of installed capacities of 45%. Increase in efficiency of new capacities from 26.9% to 40% can save at the referred volume of generation of elec-tric power 1.8 bn. m3 of gas or 2.1 mln. tons of equivalent fuel. Taking into account in-crease the coefficient of fuel use supply of heat by thermal power plant would not be re-duced.
2.2.5. Description of Innovation Scenario
Proceeding from the proposed potential of renewable sources of fuel, by 2020 bal-ance of fuels and energy resources in energy sector can look approximately as follows:
- Fuel oil – 1.4 mln. tons of equivalent fuel;
- Coal – 0 mln. tons of equivalent fuel;
- Liquefied gas – 0.2 mln. tons of equivalent fuel;
- Gas, generated by Oil refineries – 0.45 mln. tons of equivalent fuel;
- Domestic fuel oil – 0.1 mln. tons of equivalent fuel;
- Peat and lignin – 0.75 mln. tons of equivalent fuel;
- Wood fuel – 4.45 mln. tons of equivalent fuel;
- Biogas – 1.25 mln. tons of equivalent fuel;
- Plant growing waste – 1.46 mln. tons of equivalent fuel;.
- Wind engineering – 12.3 bn. kWh – 4.3 mln. tons of equivalent fuel;
- Turbine expansion engines – 0.65 bn. kWh – 0.25 mln. tons of equivalent fuel;
- Turbines in boiler houses – 0.85 bn. kWh – 0.32 mln. tons of equivalent fuel;
- Heat utilization units – 2 mln. tons of equivalent fuel;
- Hydropower plants – 0.4 bn. kWh – 0.15 mln. tons of equivalent fuel;
- Import of electric power – 1.12 mln. tons of equivalent fuel;
- Natural gas – 10.7 mln. tons of equivalent fuel;
- Potential of energy efficiency in gas generation of electric power (increase of ef-ficiency in generation of 14.1 bn. kWh from 26.9% to 40%) – 2.1 mln. tons of equivalent fuel.
Total – 28.9 mln. tons of equivalent fuel taking into account use of potential of energy efficiency in generation of electricity.
Taking into account phytomass (energy cultures) which can be grown at depleted peatlands and others places, renewable sources of energy potential can be increased by some mln. tons of equivalent fuel.
Balance in electric power engineering, based on envisaged consumption 41 bn. kWh by 2020, may look as follows:
- Fuel oil – 1.7∙bn. kWh;
- Wood fuel – 2.5 bn. kWh (based on consumption of 1.25 mln. tons of equivalent fuel by thermal power plants and 3.2 25 mln. tons of equivalent fuel in boiler houses) .
- Biogas – 2.5 bn. kWh;
- Plant growing waste – 3 bn. kWh ;
- Wind turbines – 12.3 bn. kWh;
- Hydropower plants – 0.4 bn. kWh;
- Turbine expansion engines – 0.65 bn. kWh;
- Steam generated by boiler houses – 0.85 bn. kWh;
- Import – 3 bn. kWh;
- Natural gas – 14.1 bn. kWh.
2.2.6. Cost of Capital Construction in Innovation Scenario
Cost of wind energy generating units with aggregate capacity circa 7,028 MW is US$ 7 bn.
Specific cost of biogas installations amounts to US$ 2,000 per KW. Based on gen-erating 2.5 bn. kWh (circa 380 MW with efficiency of use of installed capacities of 75%) the cost of biogas installations would be US$ 0.76 bn. At the same time due to produc-tion of fertilizers the payback period for biogas installations decreases considerably and may take several months.
Cost of thermal power plant using wood raw material and waste of plant growing can be compared with the cost of coal-fired thermal power plants – US$ 2500 per kW. Taking into account generation of 5.5 bn/ kWh using wood and waste of plant growing the required capacity would be 840 MW with efficiency of use of installed capacities of 75% worth US$ 2.1 bn.
Based on calculation of US$ 1,450 per KW, cost of modernization and/or commis-sioning of new 3,500 MW capacities, based on cogeneration units would be US$ 5.08 bn.
2.3. Summary Data on Nuclear and Innovation Scenarios
To simplify comparison, identical parameters of absolute growth of energy con-sumption are adopted in both scenarios: growth of consumption of electric energy from circa 34 bn. kWh to 41 bn. kWh in 2020 and growth of consumption of primary resources in fuel oil balance from 28 mln. tons of equivalent fuel up to 31 mln. tons of equivalent fuel.
") Figure 11 - Nuclear Scenario, balance of domestic fuel oil, (mln. tons of coal equivalent)
Figure 11 - Nuclear Scenario, balance of domestic fuel oil, (mln. tons of coal equivalent)
The nuclear scenario does not provide for cardinal escape from gas dependence – decrease in consumption of gas is 23%. At the same time, there is a necessity of solving the problems traditionally inherent for atomic engineering (see Section 4).
") Figure 12 - Innovation Scenario: balance of fuel oil (in mln. tons of equivalent fuel)
Figure 12 - Innovation Scenario: balance of fuel oil (in mln. tons of equivalent fuel)
Cost of capital construction in electric power industry (on available data) is taken for evaluation of cost of scenarios.
Table 7 - Comparison of the nuclear and innovative scenarios in the Belarusian electric power industry till 2020
| Nuclear scenario com-missioned / upgraded capacities, MW | Innovation scenario commissioned / up-graded capacities, MW | Costs of capi-tal construc-tion, US$ per KW | |
|---|---|---|---|
| Gas generation | 3000 | 3500 | 1450 |
| Nuclear generation | 2000 | 0 | 2140 |
| Wind energy generating units | 5 | 7000 | 1000 |
| Biogas installations | 0 | 380 | 2000 |
| Generation using waste wood and plant growing waste | 0 | 840 | 2500 |
| Peat and lignin | No data | No data | |
| Hydro power plants | No data | No data | |
| Turbine expansion engines | 60 | 100 | No data |
| Steam energy of boiler houses | No data | No data | No data |
| Solar energy | 0 | No data | No data |
| Cost of investments in US$ bn. | 8,63/10,9* | 14,9 | |
| Amount of replaced gas in energy sector, in bn. m3 | 4,35/4,23** | 9,2 | |
| Specific cost of the replaced gas, US$ bn/bn. m3 | 2/2,6*** | 1,6 |
*Taking into account infrastructure and additional hot reserve
**Taking into account gas to ensure additional hot reserve (about 0.12 bn. m3)
***Taking into account cost of infrastructure, additional hot reserve and gas volume to ensure additional hot reserve
In the innovative scenario within 15 years decrease in consumption of gas in en-ergy sector is considerably higher than in nuclear, – almost by 50% or 9.2 bn. m3 from 18.5 bn. m3 to 9.3 bn. m3.
The innovative scenario appears to be more expensive that the nuclear one in abso-lute values because it allows saving almost 5 bn. m3 of natural gas more than the nuclear scenario.
If recalculated by specific cost of saving of gas volume unit, the innovative sce-nario appears 20-40% cheaper. It is proved to be true by official data of cost of using own fuel and energy resources, in which a significant share is taken by renewed sources.
Use of one of the Kyoto protocol financial mechanisms – projects of joint imple-mentation can become an additional source of financing for the innovation scenario. In the cost of reduction of emissions, where 1 ton of CO2 is worth US$ 10, the sum received under project of joint implementation for use of biogas would reach US$ 250 mln.
Taking into account specific expenses accompanying the nuclear scenario, the in-novative scenario becomes even more attractive.
From the point of view of cost of generated electric power, both scenarios are comparable. However, taking into account economic risks, fuel restrictions, subsidizing of atomic engineering the innovative scenario is, at least, more stable.
Table 8 - Comparison of economic effect of using own fuel and energy resources (for 2006-2010) and construction of NPP (based on the data of the Republic of Belarus Government, [2, 9])
| Capital invest-ments, in US$ mln. | Expected economic effect, in thousand tons of equivalent fuel | Specific capital in-vestments, in US $ / tons of equivalent fuel | |
|---|---|---|---|
| Local of fuel and energy re-sources | 747,8 | 1380,0 | 542 |
| NPP/NPP + infrastructure | 4280,0/5780,0 | 5000,0 | 856/1156 |
3. Correctness of economic calculations in the course of taking decision to build a nuclear power plant in the Republic of Belarus
Political decision to build a nuclear power plant in the Republic of Belarus was accompanied by economic calculations and scientific estimates. According to estimates of experts of the Sosny Institute of Power and Nuclear Researches [3], the nuclear sce-nario is cheaper from the point of view of long-term macroeconomic parameters in com-parison with modernization of gas generation, based on combine-cycle plant technolo-gies. According to point of view of the National Academy of Sciences [8], the nuclear power plant stabilizes the cost price of the electric power in the Republic of Belarus en-ergy supply system at the level of US$ 0.13 per kWh rather than the predicted US$ 0.18-0.21 per kWh by 2025-2030 in the “gas” scenario [8].
However, estimates of experts justifying advantage of construction of the nuclear power plant contain a number of basic discrepancies which demands additional calcula-tions and double checking of the received results.
Choosing alternatives. As it is mentioned in [7], for the last 25 years in no coun-tries of the world with market economy any private company has dared investing in nu-clear engineering without support of the state or without granting guarantees of purchase of the generated energy. In Russia the program of support of nuclear engineering pro-vides for allocation of circa RUR 1 trillion (US$ 40 bn. in the 2008 prices).
The guarantee of purchase of the generated energy means that the power supply companies should buy energy of the nuclear power plant, even if it is going to be more expensive than energy of other power plants. This fact best of all testifies that statements about the low cost price of nuclear energy are not always fair.
Comparing cost of construction of nuclear power plants and combined cycle plants. The comparative characteristic of nuclear power plant and combined cycle plants is very important in choosing energy sector scenarios. Economic preference of this or that scenario depends on what primary capital investments are required to develop gas and nuclear generation.
In the proposed nuclear scenario the cost of nuclear power plant is obviously un-derestimated. According to the point of view of experts of the Sosny Institute of Power and Nuclear Researches [3], specific cost of combined cycle plants is almost equal to capital construction cost of the nuclear power plant of US$ 1,116 per kW against US$ 1,126-1,299 per kW for combined cycle plants. At the same time, data for nuclear gen-eration is taken as of 2000 while cost of combined cycle plants is referred to as of 2007-2008 and even this figure is, most likely, overestimated taking into account experience of construction of combined cycle plants in the Republic of Belarus.
Technical and economic characteristics of 30 year old equipment are used for comparison. (Shlyakhin P.N. Steam and Gas Turbines, M, “Energy”, 1974). During this time characteristic of gas turbines and especially combined cycle plants have been im-proving much faster in comparison with “purely” steam ones, including for nuclear power units. World experience of construction of nuclear power plants show that cost of construction of nuclear power units 1.5-2 times exceed the cost of construction of com-bined cycle plants.
By the way, trends of growth of cost of these two technologies, on the example of foreign experience show that this gap increases. For example, according to Cambridge Energy Research Associates Inc. report from 2000 to early 2008 materials for construc-tion of nuclear power plant have grown by 173%, whereas for gas only by 92%.
Growth of cost of nuclear power plant during construction. In the course of con-struction cost of nuclear power plant grows taking into account growing requirements to safety of nuclear power plants, and initially underestimated cost of capital investments. As a result, during construction of the nuclear power unit, which takes 5-7 years, the cost of nuclear generation, grows considerably. For example, the cost of construction of third unit of the Kalininskaya nuclear power plant has exceeded the estimated one by 110% (see Section 4)
Growth of cost during construction is a very important factor in evaluating pay-back and profitability of nuclear projects. So, analysis of sensitivity of the project to in-crease in volume of capital investments into construction of the nuclear power plant (2 power units VVER-1000) is prepared for the second stage of the Balakovskaya NPP. Analysis, executed by authors of the Balakovskaya NPP project has shown that the pro-ject has a net discounted income equal to zero with increase in volume of capital invest-ments into industrial construction by 60% [14]. In case of construction, for example, of the third unit of the Kalininskaya NPP the excess was 110%.
Taking account of natural gas required to increase hot rotating reserve. The nu-clear power plant should work in base mode, and is not designed to regulate capacity of power supply system. In such mode there are no restrictions on speed of dumping load, however, the rise of load is carried out very slowly, by steps with time delay at each step to prevent damage to fuel. Therefore, the number of unloading of units is very limited and intended mainly for scheduled and emergency dumps of loading or stopping units in case of equipment is damaged. According to the National Joint Stock Energy Company “Energoatom”, the number of regime unloading of units of the nuclear power station in Ukraine within the year ranges between 0 and 4 – 6.
 Figure 13 - Load of NPP in Ukraine in 2004 in accordance with actual repairs. Source:
website of the “Energorynok” State Enterprise
Now capacity of the largest power units in “Belenergo” is 330 MW. After com-missioning in 2010 of PGU-450 combined cycle plant at the Minsk thermal power plant-5 capacity of the largest unit will reach 450 MW. Construction of the nuclear power plant with 1,000-1,150 MW capacity of power units will demand creation of additional hot re-serve of at least 550 MW.
When equipment is in hot reserve (with 50% of nominal capacity) the consump-tion of fuel increases approximately by 10%, i.e. the 1,000 MW of hot reserve consumes 260,000 tons of equivalent fuel per annum. In this connection it is necessary to introduce a correction into calculation of fuel balance of the republic by quantity of additional gas required to maintain a reserve for the nuclear power plant – circa 140,000 tons of equiva-lent fuel per annum.
Taking account of cost of regulating capacities. Integration of nuclear generation of approximately 25% of total installed electric capacity with share in generation of elec-tric power of 32% is a complex technological task. According to [2], it will lead to com-plexity in passing daily dips, necessity to build special regulating capacities (pumped-storage hydropower plants, heat accumulators, etc.) Cost of regulating capacities, as well, should be considered in the nuclear scenario.
In this situation in Ukraine, operational planners of the State Enterprise “Ener-gorynok” and National Energy Company “Ukrenergo” have to envisage within a year re-strictions of generation of the nuclear power plant, even with minimizing of load on thermal power plants below minimum level – admissible for “survivability” of plants.
Figure 14 shows that base loading in the Republic of Belarus is circa 3,300 MW. Peak loads show extent of acuteness of future problem of daily and weekly regulation of capacity of gas-fired thermal power plants with commissioning of the 2000-2300 MW nuclear power plant.
") Figure 14 - Typical weekly schedule of electric load of united energy system of Belarus in heating season (2007)
Figure 14 - Typical weekly schedule of electric load of united energy system of Belarus in heating season (2007)
Taking into account an average regulating opportunity of condensing plants units at the level of 0.46 construction of nuclear power plant, as well, will require construction of hydro-accumulating power plant of at least 1,000 MW capacity.
Evaluating costs of nuclear power plant tariff taking account of international experience. According to the data provided in [8] with reference to the International Atomic Energy Association, at present, the cost price of electric power, generated by nu-clear power plants in France is € 0.0254 and €0.393 per kWh at discounting rate of 5 and 10% accordingly.
However, in practice it is far from being like this. In 2008 growth of cost of reac-tor under construction in Flamanville (France) by 20% from €3.3 to 4 bn., Areva Com-pany has increased the predicted cost of the marketed electric power from €0.046 to €0.054 per kWh that is obviously higher than the declared of € 0.0254 – €0.393 per kWh.
Concerning cost of energy of the Russian nuclear power plants abroad it is neces-sary to refer to results of the recent tender for construction of the nuclear power plant in Turkey where the Russian company Atomstroyexport turned out to be the only partici-pant of the tender. The Atomstroyexport bid quoted the price of US$ 0.2079 per kWh for the supplied electric power from the Russian designed power units. Even if the discount rate is taken into account the cost price with such supplied price will obviously exceed the threshold of “stabilizing cost price” of US$ 0.13 per kWh. In this connection expert community in the Republic of Belarus should investigate a situation around the tender for construction of the nuclear power plant in Turkey and [find out] the reason of difference between cost price of the Russian designed nuclear power plants in Russia and abroad.
At the same time it is necessary to consider the indisputable fact that growth of nuclear power plants tariff in Russia is restrained inter alia due to numerous subsidies. Underestimation of share of subsidies in nuclear engineering in calculations of the Bela-rusian experts leads to erroneous estimates of the nuclear power plant tariff. Among the schemes of subsidizing of the Russian energy sector it is necessary to allocate at least the following:
- Direct budget subsidies,
- The foreign assistance,
- Tax privileges.
Annually the Russian Federation Federal Budget allocates significant means to atomic engineering within the framework of Programs, like “Safety of Nuclear Industry of Russia”, “Safety of Nuclear Power Plants and Research Nuclear Installations”, “Safety and Development of Atomic Engineering”. In total within the framework of these pro-grams up to RUR 2.5 bn. was allocated annually (data as of 2004). Till 2015 circa RUR 700 bn. of budgetary resources will be allocated solely for construction of new nuclear power plants within the framework of one more program, aimed at development of nuclear complex.
One more example of direct subsidizing, which is possible to refer to, is maintain-ing, at the expense of the state of the internal forces military units providing physical pro-tection of NPPs and nuclear technological cycle objects. It is difficult to evaluate the volume of resources to maintain military units, however to protect each NPP circa one company of internal forces is required. Much more servicemen are needed to protect some of the nuclear technological cycle enterprises. For example, protection of Mountain and Chemical Plant is protected by internal forces regiment.
Within the framework of foreign gratuitous assistance Rosatom receives or re-ceived assistance within the following (but far from limited to) international programs:
- Swedish International Project;
- European Commission ТАCIS Program;
- The USA International Program of Nuclear Safety;
- The Great Britain Nuclear Safety Program
Based on results 2003 activities took place within 152 international projects worth US$ 164 mln. In August, 2003 Finland solely allocated to “Rosenergoatom” circa RUR 300 mln. to improve safety of the Leningradskaya Nuclear Power Plant. In 2003 the German Government has allocated gratuitous assistance up to €7.02 mln. for implement-ing projects on physical protection of nuclear materials in territory of the Russian Federa-tion. According to Chamber of Accounts data, in 1998-2000 more than US$ 270 mln. was received from foreign states and organizations as international assistance to finance activities, related to disposal of radioactive waste.
Due to adoption of the Law “On Exemption of Property Tax of Enterprises, En-gaged in Storage of Radioactive Materials and Radioactive Waste”, amendments have been approved to the Russian Federation Tax Code, according to which organizations, engaged in storage of radioactive materials and radioactive waste, are exempted of prop-erty tax – 2.2% of the real estate cost. Taking into account solely the cost of property of operating storehouses, Rosatom can receive up to RUR 2 bn. of latent subsidies in the form of tax exemption.
Aggregate subsidies, taking into account failure to implement social programs, ac-cording to [16], reduce the cost price of nuclear energy approximately by 30%.
It is possible to state that similar schemes of subsidizing are envisaged in Belarus, as well. For example, according to the recently adopted Law of the Republic of Belarus “On Atomic Energy” it is assumed that “for a nuclear power plant or its unit a fund for decommissioning is formed due to the means received from sale of electric and thermal energy and rendering of other services, and due to other sources, which are not contradicting to the legislation”. Actually the Law opens a way to use budgetary funds to form the fund for decommissioning of the nuclear power plant from operation and other articles of expenditures, typical only for atomic engineering.
 within 20 years till February 2009, US$/lb") Figure 15 - Change of price of unenriched uranium (protoxide, U3O8) within 20 years till February 2009, US$/lb
Figure 15 - Change of price of unenriched uranium (protoxide, U3O8) within 20 years till February 2009, US$/lb
Evaluating growth of uranium fuel cost. According to [3], researches aimed at optimizing the Republic of Belarus power supply system adopted growth of fuel cycle cost by 0.5% per annum. Cost of fresh fuel approximately by one third is formed from cost of natural uranium. A stable price before, from mid 2003 natural uranium price has sharply grown from US$ 10-12/lb. to US$ 130/lb. by 2007 or more than 10 times (Fig. 15). And though the major growth has fallen on spot market of uranium, nevertheless, contract prices have grown considerably, as well. Shortage of supply in the natural ura-nium market the tendency of accelerated growth of cost of uranium is only becoming more expressed.
 Figure 16 - Change in prices for oil during 20 years, US$/bbl
Figures 15 and 16 show that since 2004 the price for uranium grew together with oil price, and price for uranium began to fall prior to oil prices – since August 2007. However, if oil price has returned practically to initial condition, prices for uranium have remained at quite high level – as of 9 February 2009 uranium was worth US$ 48/lb. or 4 times higher than prior to 2003. Thus, it is possible to draw a conclusion, that the ura-nium market reflects objective tendencies of uranium price rise, connected with limited offer of uranium in the market.
The last 4-5 years markets of conversion and enrichment of uranium saw a proved significant growth.
 Figure 17 - Change of price for services to convert uranium U3O8 to UF6, US$ per kg UF6 for various processors
Figure 17 shows that cost of conversion since 2004 has grown from US$ 7 to ap-proximately US$ 10 per kg, an increase of more than 40% during 5 years. Cost of en-richment also experiences spasmodic growth – from US$ 110 to US$ 160 per unit of separation activities (since 2005 growth of approximately 45%).
 Figure 18 - Change in prices for services to enrich uranium, US$ per unit of separation activities
On the background of reduction of prices for oil and natural uranium services on uranium enrichment continue to rise in price.
Evaluation of growth of cost of disposal of the depleted nuclear fuel. Speaking about cost of disposal of depleted nuclear fuel, it is necessary to note that here, as well a steady growth is observed exceeding 0.5% per annum. So, in 2009 Rosatom has in-creased prices for storage and reprocessing of depleted nuclear fuel from the Ukrainian nuclear power plants by approximately 17% from US$ 360 per kg to US$ 423 per kg.
In this connection it is possible to state that in the nearest decades rates of growер of fuel cycle cost at all stages will obviously be exceeding the declared 0.5% per annum.
Choice of discounting rate. In calculations [3], the underestimated discounting rate of 5 or 10% is used. Therefore, the average discounting rate of 7-8% is assumed. It is possible in case the state subsidies are available (construction in the country or preferen-tial export credits). For comparison an average interest rate for loans and credits, ex-tended by the World Bank is 13%.
4. Risks of nuclear scenario
Below there are additional risks that should be considered in the process
of decision-making to develop nuclear generation in the Republic of Belarus.
4.1. Risks of Accidents
In opinion of the experts speaking in favour of construction of the nuclear power plant in RB, modern nuclear power plant design of new (third) generation have much smaller risk of leak of radioactivity outside the reactor unit – 10-7-8 per reactor per annum. For comparison the risk of accidents with radioactivity leaking outside reactor unit for the Chernobyl type reactors is evaluated 10-3-4 per reactor per annum.
There is an opinion in nuclear branch that tank-type reactors cannot blow up by definition as they possess natural safety: disappearance of decelerator as a result of reactor zone overheating leads to discontinuation of nuclear reaction. However, under certain conditions thermal explosion of tank-type reactors is possible. As an example it is possi-ble to refer to the accident at submarine in the Chazhma bay in 1985, where explosion has occurred exactly on tank-type reactor.
The fact about risk of large-scale accident at modern nuclear power plant is pre-sent and it is high enough is confirmed by plans of Rosatom, which is not going to build nuclear power plants in immediate proximity Moscow and Saint-Petersburg in spite of the fact that these cities experience the sharpest shortage of capacities possessing, at the same time, a necessary infrastructure, professional staff and so forth.
A similar situation has taken shape in the Republic of Belarus as well. It is decided to abandon a civil-engineering project of building a NPP near capital of the republic, though nearness of Minsk and presence of LEP-750 transmission line, passing close to Minsk creates favorable technological and economic preconditions for construction of nuclear power plant near Minsk.
The official recognition of danger of NPP is noted in the State Comprehensive Program of Modernization of Main Production Assets of the Belarusian energy system, energy efficiency and increase in share of use in the republic of own fuel and energy re-sources in 2006-2010 according to which admits that NPP is an object with increased po-tential danger to environment.
Risks of large accident resulting from plane crash. Power generating unit VVER-1000 proposed for construction has a protective coat, capable to sustain impact of crashed sport plane weighting 20 tons, however, passenger planes with fuel onboard can weight ten times more. Here it is necessary to note that no country of the world can boast having 100% guarantee of protection against attack on NPP, using an aircraft.
The risks of large accident connected with poor quality of construction. The Russian nuclear engineering experiences sharp shortage of professional builders. Out of 55,000 builders needed today Rosatom has only 5,000 professional builders. Low appeal of nuclear branch is connected, inter alia, with low wage of builders. For example, at construction of the second unit of the Volgodonskaya NPP in the Rostov region a profes-sional builder receives RUR 6,300 a month (data as of early 2006) As a result construc-tion involves labor with poor skills. For example, the labor involved in construction of fast neutrons reactor BN-800 at the Beloyarskaya NPP in Sverdlovsk region is poor skilled workers from Tajikistan and Azerbaijan. According to 2003 data, none of workers was subjected to security check. Statistics evidences about quality of this labor: after commencement of works the number of murders and robberies in the city of Zarechny (the city serving the Beloyarskaya NPP) has increased 5-6 times. In the NPP territory thefts of nonferrous metal have sharply increased.
The risks of accidents connected with power supply system failures. Failures in power supply system lead to risks connected with the fact that switching of station to an independent mode (diesel engine-generators) may not work. In 1992 a hurricane resulted in disconnecting the Kola NPP. Emergency diesel engine-generators have not provided prompt supply energy to stop reactor.
The risks of accidents connected with long period of operation. Design of new nuclear power plants envisages operation of power units during 60 years. Such policy starts covering the running reactors, designed for 30-year operation. However, experience of extension, for example, of the third unit at Novovoronezhskaya nuclear power plant shows that after 30 years in operation susceptibility of breakdown increases. The third power unit has been commissioned in December 1971. After expiry of the term of operation (30 years), functioning of the third unit at Novovoronezhskaya nuclear power plant has been extended for 5 years. Upon termination of validity of the first extension license, Rostekhnadzor has issued one more. In 2007 Rostekhnadzor has found cracks in welded connections of branch pipes of “hot” and “cold” collectors of the first steam and gas gen-erator of the Novovoronezhskaya nuclear power plant third unit. This incident only con-firms the point of view about dangers of long – up to 40-60 years – period of operation of nuclear power units.
The risks of accidents connected with social and economic crises. In case of so-cial and economic crisis as it has happened in mid 90-ies in Russia, nuclear power plants are exposed to threat of accidents because of social protests. In the Russian atomic engi-neering history there are examples when workers of the nuclear power plant occupied nu-clear station, raising economic demands.
Risks of accidents connected with military actions. The concept of safety of the existing nuclear power plants till now has been assuming their operation only in peace time. Meanwhile, majority of the European nuclear power plants are located in territory, where in the twentieth century operations with application of heavy weapons were re-peatedly conducted. Hit of a single artillery shell, a rocket or an aerial bomb in any of buildings of the nuclear power plant will not lead to catastrophic consequences. How-ever, two exact hits would be enough for a nuclear power plant to launch an avalanche catastrophic process. So, if one shell damages and stops a turbo-generator, and the second shell puts out of order a reserve diesel engine-generating power station then circulation of water in the first contour will stop completely.
In passive cooling systems the stock of water is insufficient to ensure cooling of active reactor zone for adequately long time. Active systems of cooling cannot function without supply of electric power. In this case fusion of reactor active zone due to a resid-ual thermal emission and emission of radioactive substances outside the first contour is inevitable.
If buildings of the nuclear power plant are subjected to series of aimed shots, breaking through protective environment of the reactor building, the emission of radioac-tive substances into atmosphere and contamination of large territory is inevitable. A unit of fire of one tank or the attack plane is enough for utter annihilation of nuclear power plant as power object and contamination of large territory. Conventional weapon applied against a nuclear power plant, becomes weapons of mass destruction .
As well, the scenario of using heavy weaponry in peace time should not be rejected. For example, the scenario of terrorist attack using a mobile howitzer system, which can be placed several kilometers away from the nuclear power plant outside physi-cal protection perimeter of the plant.
The risks connected with transportation and storage of radioactive waste and depleted nuclear fuel. In addition to risks, related to operation of nuclear power plant there are plenty of risks connected with transportation and storage of radioactive waste and depleted nuclear fuel. The issue of storage of radioactive waste has not been studied completely till now, as periods of storage exceed, at least, hundreds years and for de-pleted nuclear fuel, ideally – hundreds of thousand years. Here it is necessary to note that already today there are problems of leakage of radioactive nuclides outside storages areas in France and Germany after some decades of storage of radioactive waste.
4.2. Investment Risks, Related to Cost and Period of Construction of NPP
The risks connected with initially high cost of new power units. In Russia cost of construction of nuclear power plant is considerably takes the lead over inflation. During 7 years official specific cost of capital investment has grown almost 3 times – from RUR 20.2 bn. in 2000 to RUR 55.7 bn. in 2007 [5, 6]. This tendency corresponds to global processes. According to report, prepared by Cambridge Energy Research Associates Inc., the cost of materials for construction of the nuclear power plants have grown by 173 % from 2000 to early 2008, whereas for wind energy generation similar growth was 108%, for coal 78% and gas 92%.
Initially high cost of nuclear power units finds its reflection in tariffs of nuclear stations. Approximately 20% of the Russian nuclear engineering proceeds (in 2007 RUR 15 bn.) goes to construction of new power units and other infrastructure. In conditions of the set tariff level in the wholesale market (approximately US$ 0.02 per kWh) this is ob-viously not enough for construction of new nuclear power plants. The investment poten-tial of internal resources Rosatom at all does not satisfy plans of the government, aimed at accelerated development of nuclear engineering – construction of 2 power units per annum that demands circa RUR 130 bn. per annum. Moreover, the nuclear power plant tariffs prevent execution of the program of simple replacement of decommissioned power units – 3.7 GW by 2020. Existing deductions are sufficient only for construction of one reactor in 3-4 years. To solve the problem an increase in tariff approximately 2.5 times from US$ 0.02 (in 2008) to US$ 0.05 per kWh is needed.
Therefore the Russian Government had accepted the Federal Target Program, aimed at development of nuclear complex, according to which it is supposed to subsidize construction of the new nuclear power plants from the federal budget. The size of subsidies on new construction amounts to circa RUR 670 bn. till 2015.
In this respect a potential investor needs to understand precisely that construction of nuclear power units is expensive. Payback of the investments will occupy the longest period if at all it would be possible, especially in the countries with regulated energy market.
The risks connected with growth of cost during construction. Experience of completion of third unit at Kalininskaya nuclear power plant has shown that cost of 50 % completion of object has appeared comparable with design cost of 100 % construction from zero. Cost of completion of Kalininskaya nuclear power plant appeared as follows. According to Chamber of Accounts, the rest of budget cost of construction on launching complex of construction of power unit 3 of Kalininskaya nuclear power plant taking into account objects of social sphere as of 1 January 2001 amounted to RUR 8.2 bn. or 48.7% of capital investments. However, according to official data, only in 2001-2004 RUR 23.2 bn. was allocated to complete this power unit. In late 2004 the power unit has been com-missioned, but, nevertheless, another RUR 4.1 bn. was allocated for its operational de-velopment in 2005. As a result total cost of power unit amounted to RUR 35.9 bn. instead of the declared RUR 16.8 bn. or more than in 2 times exceeded the declared cost. Cost of completion that is more correct to evaluate growth of cost of construction, reached RUR 27.3 bn. and more than 3 times has exceeded the declared cost. Even with inflation taken into account such excess is significant.
Similar situation is taking shape with construction of nuclear power units in Finland and France. Cost of reactor in Finland (1,600 MW) has grown during construc-tion from contractual €3.2 bn. to €4.7 bn., at the same time the project is far from end. The declared cost of Flamanville reactor has grown by 20% from €3.3 to €4 bn. It has led to the company increasing the predicted cost of the sold electric power from €0.046 to €0.054 per kWh.
Growth of cost during construction is the major factor in evaluating payback and profitability of nuclear projects. So, analysis of sensitivity of the project “to increase in volume of capital investments into construction of the nuclear power plant” (2 power units VVER-1000) is prepared for the second stage of the Balakovskaya NPP. Analysis, executed by authors of the Balakovskaya NPP project has shown that the project has a net discounted income equal to zero with increase in volume of capital investments into in-dustrial construction by 60% [14]. In case of construction, for example, of the third unit of the Kalininskaya NPP the excess was 110%.
") Figure 19 - Growth of cost of construction of third power unit of the Kalininskaya NPP (RUR bn.)
Figure 19 - Growth of cost of construction of third power unit of the Kalininskaya NPP (RUR bn.)
The risks connected with increase of period of construction of nuclear power plant. Period of construction of one nuclear power unit lasts 5-7 years unlike other energy sectors, for example, wind energy where hundred megawatt capacity wind energy generating plants can be built within 1-2 years.
At the same time the declared periods, as a rule, are not maintained. The delay in construction of the nuclear power plant in Finland is three years after 3 years from its commencement. Thus, every year of construction means a one year delay. Initially it was planned to build a reactor in 4 years, now it turned to be 7 years. Similar problems have emerged at construction of the power unit in France.
One of the preconditions to long-term construction in the Russian nuclear complex is shortage of professional builders. According to Rosatom plans, the number of profes-sional builders should grow from 5,000 in 2006 to 55,000 by 2009 which is very unlikely.
4.3. Risks, Related to Fuel Supply
For today the unique large operating uranium deposit in Russia provides only 16-18% of the required needs for natural uranium – 3,200 tons per annum out of almost 20,000 tons of natural uranium needed (with supply to foreign nuclear plants). The “TVEL” company, responsible for fuel supply of the Russian and foreign nuclear plants, gets the difference, which is missing fuel, from “warehouse stocks”. Thus, there is a sub-sidizing of nuclear engineering due to even uranium stocks, accumulated in Soviet times, mainly as a result of implementation of military programs.
![Figure 20 - Structure of coverage of needs in raw materials of the branch till 2020 [15]](http://greenworld.org.ru/sites/default/greenfiles/images/fig20.jpg "Figure 20 - Structure of coverage of needs in raw materials of the branch till 2020 [15]") Figure 20 - Structure of coverage of needs in raw materials of the branch till 2020 [15]
Figure 20 - Structure of coverage of needs in raw materials of the branch till 2020 [15]
According to Rosatom data, stocks in storage covering needs in uranium by 30% will be exhausted by 2015 – the period of scheduled commissioning of the first nuclear power unit in Belarus. It is assumed that this source of uranium will be compensated due to opening new mines. The question of opening of new deposits in the declared volume is de-batable. Besides circa 20-25% of needs in uranium now becomes covered due to import of the depleted uranium from Western Europe (See Fig. 20 item “Import of Uranium and Raw Materials from Countries other than CIS”). Contracts on import of this uranium should end in 2009. There exists a probability, that these contracts will be prolonged, as it is reflected in [15]. However, because of danger of storage of the depleted uranium, imported in the form of uranium hexafluoride, it is most likely that these contracts will not be extended.
Taking into account retirement of these two sources, shortage of uranium will reach circa 50% of the present consumption level. Based on plans of growth of consump-tion of uranium due to new contracts to supply fresh fuel including abroad the shortage can reach the order of 20,000 tons of uranium – circa half of the global production of natural uranium.
Till September 2008 Rosatom considered the Australian companies as a possible sup-plier of uranium. However, after events of August, 2008 in the Caucasus, as it is impossible to trace, whether Australian uranium will be enriched at the Russian military facilities , Special Commission of the Australian Parliament did not recommend the Government of Australia to conclude a new contract in the field of use of atomic energy with Russia, open-ing uranium stocks of Australia to the Russian companies. The situation with Australia shows, that the risks related with supply of nuclear fuel, are aggravated with problems in the international relations and the limited number of countries-suppliers of natural uranium.
The situation in the Russian Federation is not unique. In 2005 the world production of uranium has reached circa 40 thousand tons with annual consumption of 69 thousand tons. Uranium shortage for the time being is covered by warehouse stocks and secondary sources. Based on IAEA forecasts by 2020 annual production of uranium will grow only to 65-70 thousand tons, whereas consumption would grow to 82-85 thousand tons.
 Figure 21 - Global mining of uranium and the need in uranium
As well, it is necessary to consider that now a significant part of nuclear fuel in the world market emerges due to dilution of the Russian weapon uranium. The uranium re-ceived from nuclear warheads covers 17% of the global market of enriched uranium. Af-ter 2014 when the contract on sale of the Russian weapon uranium (so-called contract VOU-NOU) will expire, it is necessary to expect a sharp decrease in offer on the ura-nium market and sharp growth of cost of nuclear fuel, possible in this respect.
4.4. Some Risks, Related to Unforeseen Growth of Maintenance Component of the Tariff
Growth of tariff in connection with shortage of uranium. Till now the Russian atomic engineering existed due to the Soviet stocks of uranium and operating mines, opened in the USSR. Opening and arrangement of new deposits demands significant fi-nancial resources. In this connection there is a probability, that partially these costs will be covered due to the tariff.
Growth of tariff with growth [of cost] of temporary storage services. According to [16], cost of storage of depleted nuclear fuel of the Russian nuclear power plants in the centralized federal storehouse until 2005-2006 was approximately US$ 60 per kg of heavy metal. Some estimates, which can be made, by referring to construction of the Balakovskaya NPP second stage, cost of temporary storage of depleted nuclear fuel from the Russian nuclear power plants has grown up to US$ 130 per kg of depleted nuclear fuel. Cost of storage of depleted nuclear fuel of the Ukrainian nuclear power plants has grown in 2009 in comparison with 2008 from US$ 360 to US$ 423 per kg of heavy metal. Therefore, no one can evaluate in the long-term prospective the real cost of stor-age, but it is clear that it only will grow, and grow considerably. The Rosatom representa-tives stated that “now people understand that it is impossible to calculate real cost of storage of fuel imported from abroad. We could accept it for 60 or 70 years, but what would happen in 100 years? In fact, nobody is able to count such costs” [17].
However, even in the short-term perspective the existing means are obviously not enough to ensure safe storage. For example, there is no appropriate system of physical protection of the centralized storehouse in the Krasnoyarsk region. In 2002 first Green Peace group of activists, and then FSB have freely entered the territory of storehouse and freely have left it.
Growth of tariff related to growth of cost of decommissioning of nuclear power units. Now tariff of nuclear power plants envisages deductions of 1.3% of the nuclear power plant proceeds for decommissioning of nuclear power units from operation. At the same time, according to S. Antipov, the “Rosenergoatom” Concern former General Di-rector “Shortage of means for decommissioning of power units has reached circa RUR 6 bn. in 2004, whereas by 2010 it may exceed RUR 8.5 bn.” [18].
It is important to consider that shortage 6 times exceeding annual deductions for decommissioning from operation, exists in a situation when the first 4 power units with aggregate capacity circa 1 GW are withdrawn from operation, whereas the deduction is made of the proceeds received as a result of operation of 23 GW capacities. In this con-nection “Rosenergoatom” Concern considers an issue of increasing deductions up to 2.3% [19].
4.5. Economic Risks, Related to Integration of NPP and Increase of Accidents in Power Supply Network
Construction of the nuclear power plant will lead in more than 50% of the electric power in the country generated by two plants – the nuclear power plant (2,000 MW) and the Lukomlskaya State District Power Plant (2,430 MW). Such concentration of capacity is fraught with large power interruptions in the system and heavy losses for economy. “Perfidy” of work in peak mode is in long-term influence on damageability and break-down susceptibility of units and their elements (boilers, turbines and generators) and amount of various repairs rather than in over expenditure of fuel in each cycle (i.e. in de-crease in blocks profitability). The majority of accidents at plants happen more often at start-up of units from “cold” condition – explosions of boilers, damages of turbo genera-tors’ shafts and breakage of turbine blades which sometimes lead to human victims. The damage from accidents is estimated in dozens and hundreds of million dollars.
4.6. Transboundary Risks of Nuclear Power Engineering Nuclear power plants in the Baltic Region
Construction of nuclear power plant in the Republic of Belarus is envisaged in wa-ter catchment basin of the Baltic Sea – environmentally vulnerable area, which has lim-ited water exchange with open part of the ocean. It means that in case of accidents at nuclear power plants, accompanied with discharge or dumping radioactive nuclides it would impact other countries and sea ecosystems around this semi-closed environmental space.
It is necessary to take into account that in the Western part of the Baltic Sea there takes place a process of decommissioning of nuclear power plants and ideas of new con-struction are abandoned [23].
Condition of power units
a) operational
b) planned
c) being decommissioned
d) run in excess of designed resource
e) planned export of nuclear power generated electricity
At the same time in the south and east of the Baltic Sea new project of nuclear power plants are being promoted. So, in the southern part political decisions have been taken to build at least 6 new power units for nuclear power plants a couple of hundreds of kilometers away from each within the nearest 15 years. It means that each separate solu-tion does not take into account aggregate or cumulative risk of all nuclear power plants for each country and for the Baltic Sea region in general.
It is known that risks related to functioning of nuclear power plants are the highest in the initial period of their operation and by the time when they are about to deplete their resource. Commissioning, within a number of years, of six power units in Belarus, Lithuania and Russia (Kaliningrad nuclear power plant) and si-multaneous decommissioning of the Ignalina nuclear power plant would result in highest probable emergency situations at NPP. However, these transnational risks have not been taken into account in the course of decision-taking to build a nuclear power plant.
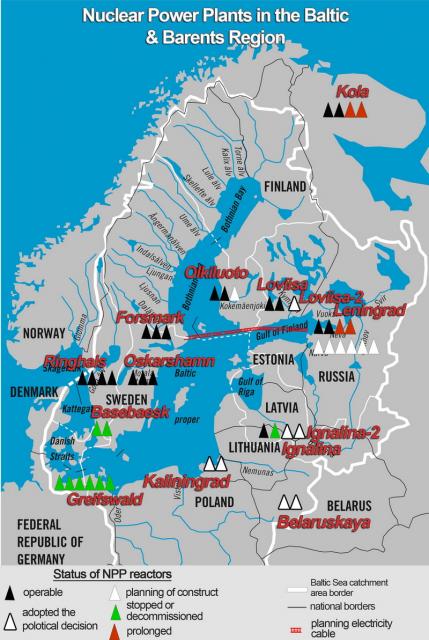
4.7. Economic Risks, Related to Decommissioning of Power Plants
As a rule, all life cycle of nuclear power plant is not considered in the course of economic evaluation of nuclear engineering. Modern power units of nuclear power plant are planned by designers to generate electric power within approximately 50-60 years, the time, during which main elements of the equipment lose their properties, allowing their safe operation, and the “know-how” of energy generation becomes morally out-dated. From the moment of the termination of operation the nuclear power plant’s unit – the source of energy and income is transformed to the object consuming energy and re-sources.
Up to hundred thousand tons of the equipment and structures of such power unit become waste with significant part contaminated with radioactivity. It means that such object should be isolated reliably from habitat to prevent an opportunity of radioactive nuclides penetrating into biosphere and through food chains to humans. Besides it is nec-essary to exclude an opportunity of unauthorized access to this radioactive waste.
Concerning buildings and structures of the decommissioned nuclear power plants choosing one of the alternative strategies is possible:
- Immediate, stage-by-stage dismantling of the least polluted objects;
- The postponed dismantling in 50 and more years following decay of the signifi-cant part of radioactive nuclides.
In the course of decommissioning from operation a separate issue is recycling of depleted nuclear fuel, which is unloaded from reactor to the pools with cooled water, lo-cated next to reactor. Some years later fuel cores are moved to the pools of temporary storehouses cooled by the electric power. Then, in process of cooling cores, these are placed into special containers where depleted nuclear fuel continues to be cooled due to natural air circulation.
At present in the world there are no technologies of reprocessing of depleted nu-clear fuel that are safe for the nature and economically justified. Special danger of de-pleted nuclear fuel is caused by presence of radioactive nuclides there, which practically did not participate in millions of years of evolution of living systems on Earth. Among such radioactive nuclides, for example, is Plutonium (239Pu), which has half-life period exceeding 24,000 years. During life of the nuclear power unit from the beginning of operation prior to exhausting resource up to thousand tons of depleted nuclear fuel, contain-ing tons 239Pu is generated.
Depleted nuclear fuel should be isolated reliably from biosphere during hundreds thousand years. In the USA, following the Supreme Court’s decision reliability of isola-tion of the depleted fuel cores should be guaranteed for the period of 1 million years. At present there are no technological solutions, capable of solving this problem.
Modern data about cost of decommissioning power units from operation contain plenty of uncertainties, related to difference of decommissioning possible scenarios, na-tional policies of disposal of radioactive waste, depleted nuclear fuel, level of develop-ment of technologies in different countries, etc.
Table 9 - Costs of decommissioning of NPP units in different countries [23, 27]
| № | NPP, country | Type of reac-tor; capacity, MW | Cost, in US$ mln. | Notes |
|---|---|---|---|---|
| 1 | Big-Rock Point, USA | BWR, 70 | 25,0 | Upon unloading of depleted nuclear fuel the reactor body is removed. Total weight of radioactive waste was 290 tons. Storage of depleted nuclear fuel was left at the site – 43.3 ha. NPP used to occupy 182.2 ha. |
| 2 | Fort-Saint Vrain, USA | HTGR, 330 | 173,9 | Immediate dismantling option is adopted. Turned into gas turbine power plant |
| 3 | Maine Yankee | 900 | ~ 500 | Immediate dismantling to “green lawn” condition. Dry storage of depleted nuclear fuel is created close to the power plant’s territory. NPP territory after dismantling was reclaimed. |
| 4 | Tokai Mura, Japan | GCR, 166 | 772,5 | Dismantling started in 2001, would be over in 2017. 177,000 tons of radioactive waste is gener-ated in the course of dismantling, of which 18,000 tons are highly active. |
| 5 | Stade, Ger-many | PWR, 672 | 668,4 | First NPP, decommissioned after adopting the Law on closure of NPP. 150 of 300 persons left at the process of dismantling. |
| 6 | Biblis-A, Ger-many | PWR, 1225 | 141,2 | Evaluation of costs for full decommissioning of power unit. |
| 7 | Loviisa-1, Finland | VVER, 440 | 166,5 | Evaluation of costs for decommissioning to “brown lawn”. |
| 8 | Greifswald, Germany | VVER, 5×440 | 4 000 | Evaluation of costs for full decommissioning of 5 power units to the “Technopark” stage during 1990-2035. Up to one third of operations personnel is involved in decommissioning of former NPP. |
| 8 | Inganlina NPP, Lithuania | РБМК, 2×1500 | 1 500(3 300) | Evaluation of costs for full decommissioning of 2 power units to the “Technopark” stage. Activities of decommissioning started at 1 power unit. De-pleted nuclear fuel would be temporarily stored in “dry storage” containers. Costs of activities have more than doubled in some years after commence-ment. |
In a number of countries the state and maintaining organizations have made such evaluations. For example, the US Council on National Resource (NRC) and Nuclear En-ergy Agency (NEA) has estimated the cost of decommissioning from operation as 10 – 15% from cost of construction of object. [24]
Official French sources estimated €258.86 per kW of the installed capacity (data as of 1998). [25]
Estimation of cost of decommissioning from operation of the power unit with VVER-400 reactor, according to IAEA, can make US$ 350 mln. with immediate disman-tling and US$ 300 mln. in case dismantling is postponed by 40 years (US$ 795 and US$ 690 per kW of the installed capacity respectively). [26]
At the same time, practical experience of decommissioning from operation shows that the referred figures are essentially underestimated. So, in Germany expenses for de-commissioning of power units of the nuclear power plant with VVER-440 have more than 2 times exceeded the IAEA predicted. In the course of decommissioning from op-eration of 6 power units of nuclear power plant “Nord” costs would amount to €3.2 bn (US$ 4.4 bn.) or US$ 1,700 per KW. The “Nord” nuclear power plant will be decommis-sioned during 45 years from 1990 till 2035 to the condition of “brown lawn”, creating a technopark at the site of the former nuclear power plant. At the same time there will be unresolved problem of depleted nuclear fuel, which is in temporary (for 50 years) store-house. [23]
Originally Lithuania planned to spend €1.2 bn. for decommissioning from opera-tion of the two RBMK-1500 (2×1500 MWе electric power) power units during 30 years. This was evaluation of costs of decommissioning to condition of “brown lawn”, the or-ganization of depleted nuclear fuel temporary storage in metal concrete containers and organization of technopark. Later some years after commencement of the decommission-ing program this sum has increased to €2.5 bn. or US$ 1,100 per kW of the installed ca-pacity. In the future these expenses will undergo an increase as the technology of recy-cling of 3,400 tons of graphite (inhibitor of neutrons in RBMK reactors), carbon-14 containing radioactive isotope (with half-life period of 5,400 years) is not developed yet. By the way, the technology of long-term isolation or burial in the territory of Lithuania of the depleted nuclear fuel is not developed yet.
Expenses for decommissioning (Maine Yankee) 900 MW electric capacity power unit from operation to condition of “green lawn” reached circa US$ 500 mln., having ex-ceeded expenses for construction (US$ 340 mln.). At the same time, the depleted nuclear fuel is in temporary storehouse as technologies of long-term storage or burial of depleted nuclear fuel do not exist in the USA.
4.8. Social Risks, Related to Decommissioning of Power Plants
Construction of nuclear power plants in Central and Eastern Europe were accom-panied by creation of “atomgrads” – satellite cities of nuclear power plants, with popula-tion ranging from 30 to 70 thousand inhabitants. The nuclear power plant becomes a city factory. Social infrastructure and the budget of nuclear settlements completely depend on the nuclear power plant overall performance.
“Atomgrad’s” inhabitants, as a rule, do not have historical roots connecting them with local culture. It can become a source of social conflicts with inhabitants of the neighboring settlements, who perceive the nuclear power plant and “atomgrad’s inhabi-tants as threat to their traditional way of life.
The inevitable decommissioning from operation of the nuclear power plant after exhausting fuel resource causes serious social crisis connected with one-stage loss of the large number of highly paid jobs as well as main source of receipts of local budgets. [23]
5. Trends in world power generation
The choice of technologies in energy sector of the future is rather little. According to the Russian expert community view, stipulated in the Concept of Energy Sector Strat-egy of the Russian Federation till 2030 [1], energy sources which will change developed economic, balance and environmental representations are determined as follows:
- Fast neutrons nuclear power with full fuel cycle,
- Non-conventional renewable sources of energy,
- Non-traditional non-renewable resources (gas-hydrates, etc.)
- Probably, thermonuclear power.
Here it is necessary to pay attention that among the listed technologies thermal re-actors are not mentioned – a basis of modern global nuclear power, which is proposed to be developed in Belarus. The main reason – fuel restrictions in connection with close de-pletion of cheap stocks of uranium.
Speaking about technology of thermonuclear synthesis, it is necessary to refer to opinion of E. P. Velikhov – one of the leaders of the Russian program of thermonuclear synthesis, – who has determined, that in case of success, commercial capacity of reactors, based on thermonuclear synthesis by the end of 21 centuries will not exceed 100,000 MW or some percents of the modern established capacity of all electric energy industry of the world that is insignificantly little.
Extraction of gas-hydrates is at a stage of scientific study. In case such extraction would be launched the product will be liquefied natural gas which Belarus in any case should be purchasing from abroad.
The Russian expert community thinks that only atomic engineering on the basis of plutonium and renewable power generation will remain among real sources for the near-est century perspective.
At the same time, the technology of plutonium power engineering with closed cy-cle till now is not developed. But it is already known, that this technology is extremely dangerous from the point of view of non-proliferation of nuclear weapons, more incident-prone and extremely expensive.
Among all technologies the most perspective and reliable are technologies on the basis of renewable sources of energy. At present, three technologies are leaders in the field of alternative power: generation of energy based on biomass, solar and wind energy engineering. The greatest volumes of investments and growth of capacities during the last years occur in wind power. Owing to fast perfection and reduction in price of solar photo cells it is expected, that after 2020 the solar power would become the leader of growth.
Taking into account limitation of stocks of cheap uranium and the significant risks accompanying atomic engineering, it is possible to draw a conclusion that at present only the renewable power engineering can provide energy safety and stable development both on global and national levels.
Literature
- Draft of the Concept of Energy Strategy of the Russian Federation for the period till 2030.
- The State Program of Modernization of Main Production Assets of the Belarusian Energy System, Energy Efficiency and Increase in Share of Use in Republic of own fuel and energy resources in 2006-2010, Minsk, 2005.
- A. P. Yakushev, “Nuclear Power Engineering in Belarus”, based on materials of the international conference “Energy Sector of Belarus: Ways of Development”. P. 72-84. Minsk, 2006
- A Rise in Prices for Gas: New Challenges to the Belarusian Economy. E. Rakova et al.
- The Resolution N 605, adopted by the Government of the Russian Federation on 6 Oc-tober 2006 “On Federal Target Program “Development of Nuclear Energy Industry Complex of Russia for 2007 – 2010 and in perspective till 2015”.
- “Substantiation of Investments into Construction of LNPP-2. Volume 5. Assessment of Influence on Environment”, Atomenergoproject. 2006.
- K. Hirshhauzen, I. Rumyantseva. “Economic Aspects of Development of Nuclear Engineering in Belarus”, based on materials of the international conference “Power Engineering in Belarus: Ways of Development”, pp. 85-122, Minsk, 2006
- Сopy of the letter of the Presidium of the National Academy of Sciences of Belarus, dated 3 October, 2008, 11-29/Л-238.
- Lavrentev N. A., Zhukov D. D. Belarusian Wind Energy Engineering – Realities and Prospects / “Energy and Management”, July-August, 2002, pp. 12-17.
- V. G. Pekelis. “Once Again about the Issue of Wind Energy Engineering / “Energy and Management”, 3, 2006, pp. 6-8.
- Lavrentev N. A., Zhukov D. D. “Belarusian Wind Energy Engineering” – Realities and Prospects / “Energy and Management”, July-August, 2002, pp. 12-17.
- “On Issue of Use of Wind Energy Resources of Belarus”. N. A. Lavrentev et al. based on materials of the international conference “Power Engineering in Belarus: Ways of Development”. pp. 61-71, Minsk, 2006
- “Renewable Energy Resources of Belarus: Forecast, Condition, Mechanisms of Implementation”, based on materials of the international conference “Power Engineering in Belarus: Ways of Development”, pp. 37-60, Minsk, 2006.
- The project for construction of second stage (completion) of the Balakovskaya nuclear power plant, additional materials to section 12 of the project of 2-nd stage of the Balakovskaya nuclear power plant, containing evaluation environmental impact. Section 13 the Technical and Economic Part (Volume 13, 210015.0000002.00506.510КТ.13)
- Strategy of Development and Safe Use of Nuclear Energy. Presentation of I. V. Konyshev, Adviser to the Head of Rosatom State Corporation, Murmansk, 18 February 2008.
- “What is the Cost of Nuclear Generated Electricity?” V. A. Tchuprov, M. 2004.
- Russia refuses plans on import of the depleted nuclear fuel, referring to change of priorities Nuclear Fuel, №16, 31 July 2006 http://www.greenpeace.org/raw/content/russia/ru/press/reports/622035.doc
- “Russian Nuclear Engineering Experience Shortage of Money”, “Industry and Energy Sector”, №7, July 2005.
- “General Director of the Federal State Unitary Enterprise “Rosenergoatom” Sergey Obozov is going to build 21 nuclear reactors during three year”, “Vedomosti”, 27 September 2006.
- Would there be enough energy for economic growth? Forecast of needs of Belarus in electric power till 2025 – Energy Sector and Thermal Power Plant, №4, 2008.
- Programs of Development of the Belarusian Economy and Forecast Estimates of Potential of Reduction of Emissions of greenhouse gases. A. P. Yakushev. The Sosny United Institute of Energy and Nuclear Researches, National Academy of Sciences of the Republic of Belarus. Report on 13 November 2008.
- Magazine “Energy Sector and Fuel and Energy Complex”, Ma, 2008
- Concept of action plan for decommissioning of nuclear power plant’s units that have used their designed resourses. Proposals of NGO’s dealing with environmental pro-tection. 2008 г. с.28, www.decomatom.org.ru
- “Problems of decommissioning nuclear facilities”. WISE News Communique on January 23, 1998 (reference number 485.4813). URL: http://www.antenna.nl/wise
- Report on the use of financial resources earmarked for the decommissioning of nuclear power plants. Communication from the Commission to the European Parliament and the Council. The European Commission 26.10.2004, Com (2004) 719 fi-nal.
- Nuclear Power Reactors in the World // IAEA issue 2, Vienna, 2002, р. 26].
- USA Decommission Experience // Mirovaya elektroenergetika (in Rus.) World electric power industry, 1997, № 2, p.p. 16-21